Overclocking & OC Power Usage
Power Consumption - Alder Lake Overclocked
I haven’t had a lot of time to go through all of the overclocking settings in the UEFI menu. I have only had the i9-12900K for about 5 days at the time of this writing so the biggest bump in performance will be coming from the Efficient Cores. I know that is surprising, but I will explain. The stock i9-12900K runs at 4.9GHz for all P-Cores under heavy loads and 3.7GHz on the E-cores at stock settings. Overclocking Efficient cores were much easier than overclocking the Performance Cores. I was able to bump the P-Cores up slightly to 5.0GHz (+100Mhz \+2%) and the E-Cores up to 4.0GHz (+300Mhz \ +8%) over the stock settings. So while the Performance Cores barely increased and the Efficient Cores received a decent bump; we will now see how much of an increase we gain in both performance and power consumption.
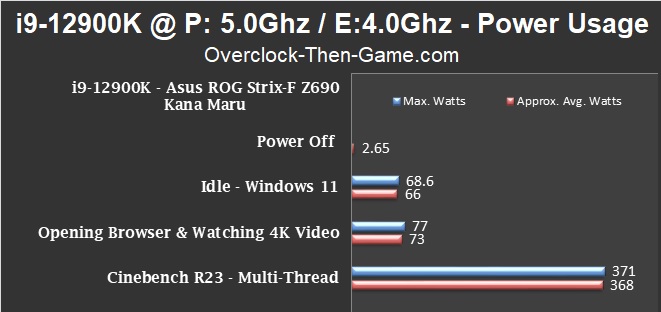
During idle periods and light usage the i9-12900K does a great job that is pretty much on par with the default stock settings. Looking at the Cinebench R23 results we can see an increase of approximately 36 watts on average over the stock settings. The maximum peak wattage increased by 41 watts. The temperature stayed roughly the same in Cinebench R23 (83c vs 79c) and Prime95 (95c vs 92c). You will definitely need top-notch cooling if you are planning to overclock the i9-12900K. It’s a good chance that you will hit the 100C limit and cause the CPU to throttle. However, as I stated earlier I’ll need more time with the Asus ROG Strix-F and Alder Lake CPU to get the most out of overclocking. So there should definitely be more overclocking articles coming soon. With that being said let’s see how the slight core frequency increase performs across several benchmarks.
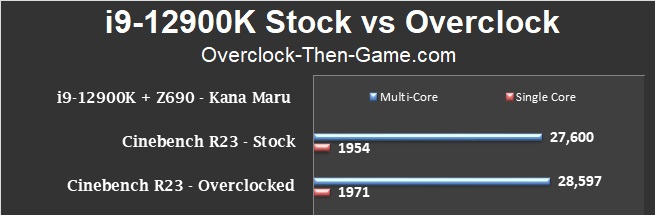
Cinebench R23 - Stock vs Overclocked
The multi-thread shows an increase of 3.6% and the single-thread shows an increase of 0.87%. I wasn’t expecting the single-thread score to increase that much since the Performance Cores frequency was only slight increased. The multi-score increase was nice though.
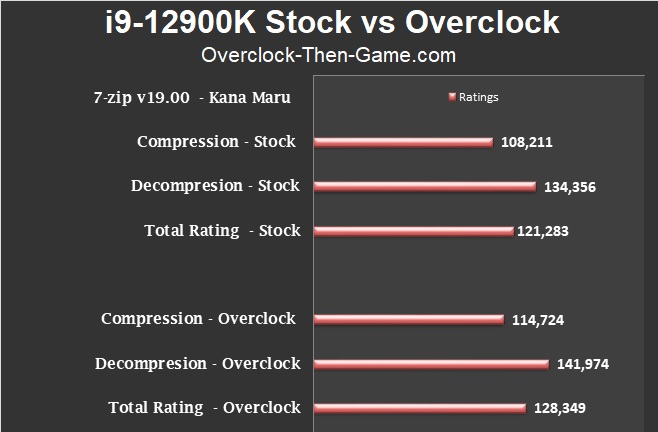
7-zip v19.00 - Stock vs Overclocked
In 7-zip we see decent performance increases during the compression & decompression tests. The Compression results increase by 6% and the Decompression improved by 6% as well. The overall Total Ratings increase was 5.82% or 6%. Not bad for a small and easy overclock.
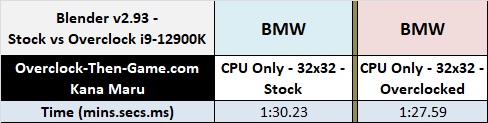
Blender v2.93 - Stock vs Overclocked
Blender shows a 3% increase. That’s small, but it could add up when you have many frames to render overtime. Most users will use either the GPU or both the CPU and GPU for rendering. This is something I plan to benchmark in the future with my RTX 3080 Ultra 240mm Liquid Coooled GPU.
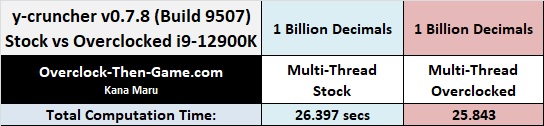
y-cruncher - Stock vs Overclocked
y-cruncher shows a 2% performance increase. Better than nothing I suppose.
Now that I have been able to compare several overclocked benchmarks against stock benchmarks one has to wonder if my slight overclock was really worth it. Well for some programs it could be worth it more than others. Overall you will see small performance increases with a small bump in frequency, but the power wattage increases as well as the temperature. For example you can expect roughly a 4.2% increase in performance, based on all of the programs that I benchmarked above, but that comes with a power wattage increase of about 10% on average when the CPU is being stressed @ 100%. The CPU temperatures will also play a part in this because you’ll want at least a 240mm\360mm or custom water cooling if you plan to overclock this CPU. On a more interesting note we will see what happens when I undervolt the Core i9-12900K while keeping the stock clocks on the next page.