Performance Core vs Efficient Core

As if benchmarking the Alder Lake micro-architecture wasn’t difficult enough I will now attempt to determine the performance within the actual IA core (L1 Cache, OOE, Execution Units, etc ). I will attempt to determine the performance of a single Performance “Golden Cove” Core and a single Efficient “Gracemont” Core. To decide which single core will be used in this benchmark I decided to use the lowest latency based on several initial tests prior to conducting the benchmarks below. I will attempt to benchmark how much bandwidth flows through the core. Afterwards I will show all Performance Cores against Efficient Cores. If you recall Alder Lake L1 Cache was as low as 1.0ns which means that it can access and retire data extremely quickly. We already know how quickly, but now my question is how much data can be processed. As I stated earlier in this review it isn’t easy determining the results so don’t shoot the messenger if I get somethings wrong. It is possible to use many instructions to determine benchmarks and performance outcomes. In these tests I tried to use the most efficient instruction sets as well as different workloads to show the maximum performance within a “Golden Cove” Core and a “Gracemont” Core. My goal is to determine the actual performance that we can expect from the Alder Lake-S uarch and if I need to update information in the future I will, however, these are my results as of today.
Maximum Single “Golden Cove” Performance

This shows a single Golden Cove under the best case scenarios that I could provide. The average BW was 760 GB\s which makes the Golden Cove blazing fast. The tests peaked at 1.07 TB\s which is amazing. The Golden Cove appears to be a serious performer and Intel’s 10nm is looking very good in this test.
Maximum Single “Gracemont” Performance

The best case scenario for a single Gracemont Core shows 283 GB\s on average. That’s not bad especially since there are 8 of them on the i9-12900K. The max performance peaked at 407 GB\s so there’s definitely some burst in performance under the correct workload scenarios.
Maximum Performance Cores vs Maximum Gracemont Cores
Now that we have seen the top performance single core results I will run all 8 Performance Cores against all 8 Efficient Cores. This test should allow maximum performance and latency should be fairly low. The goal is to test the actual cores while avoiding the L2 and L3 cache information.
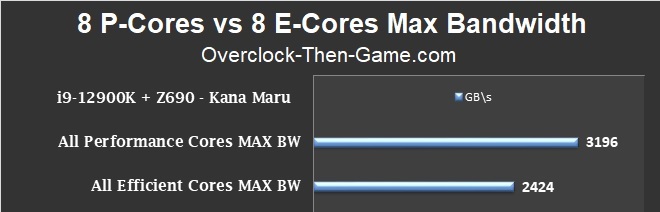
Starting with the Performance Cores first we can see that when all 8 cores are working together at the lowest level they can achieve some serious performance. Now we can see why Intel named them “Performance” cores. Under various workloads the average came out to 3,196 GB\s or in other words 3.2 Terabytes (T\Bs) a second. That is extremely high and the maximum performance topped out at 4.5 TB\s under specific workloads. Reading data is extremely fast and for data that only requires a single read and write, or data that isn’t dependent on other data, the Golder Coves moves tons of data very quickly. This is great to see as a former X58 1st Generation user. There have been many CPUs faster than my first gen, but I’m glad I decided to wait until Intel’s 10nm. Moving down to the “Gracemont” cores we see that all 8 Gracemont cores can move 2,424 GB\s on average, or 2.4 Terabytes (TB\s). This is incredible and goes to show how efficient and powerful the Gracemont cores really are when they are working together. Due to the low latency, being single-threaded and designed to produce high throughput the x8 Gracemont Cores can actually outperform the x8 Performance Cores in low latency situations that relies more on reading multiple lines of data. Earlier in the latency benchmark we saw that the Gracemont cores could access the L1 Cache 20% quicker than the Performance Cores. Well in a particular benchmark during this test the E-Cores showed a 79.2% increase over the Performance Cores. I’m sure it also helps that the Gracemont Cores are clustered as well. However, outside of that one scenario where the Efficient Cores outperform the Performance Cores, in another test the P-Cores make up for it with a 345% increase over the E-Cores. Overall when taking the average of all benchmarks performed in this test the Performance Cores are 32% faster than the Efficient Cores and of course specific tests can show much larger increases for both the Performance or the Efficient cores. Both cores have their strengths and weaknesses and so far I like what the benchmarks are showing me with Intel’s Hybrid Technology. Intel’s take on the big.LITTLE architecture seems to be a great move. Hopefully I was able to give more insight into the micro-architecture. Now we will move on to other higher level synthetic benchmarks.