Performance Core vs Efficient Core

Once again I will attempt to determine the performance within the actual IA core (L1 Cache, OOE, Execution Units, etc ). I will benchmark the performance of a single Performance “Golden Cove” Core and a single Efficient “Gracemont” Core. You can think of this as a ‘true’ single-core benchmark. It is possible to use many instructions to determine benchmarks and performance outcomes. In these tests I tried to use the most efficient instruction sets as well as different workloads to show the maximum performance within a “Golden Cove” Core and a “Gracemont” Core.
Maximum Single “Golden Cove” Performance
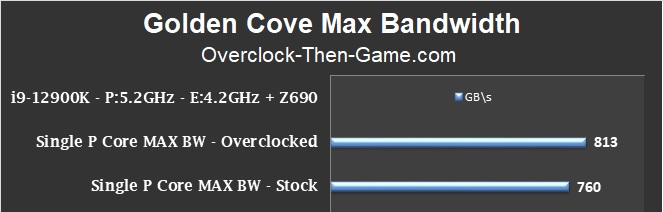
I have increased my average stock results by 53 GB\s pushing my overall bandwidth up to 813 GB\s per core. My absolute best case scenario was 1.1 TB\s meaning that an Alder Lake ‘Golden Cove’ Core is capable of some serious workloads at the micro-architecture level.
Maximum Single “Gracemont” Performance
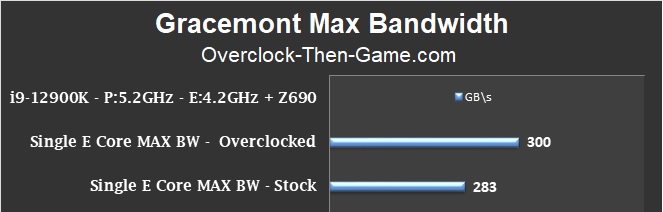
My single overclocked “Gracemont” Core performance has increased by 17 GB\s. My overall benchmarks averaged 300 GB\s and remember that there are 8 total “Gracemont” Cores. My best case scenario for a single overclocked “Gracemont” Core is 480 GB\s compared to only 407 GB\s for the stock results. That is an addition of 73 GB\s (18% increase). We will take a look at all of the Efficient Cores working together below.
Maximum Performance Cores vs Maximum Gracemont Cores
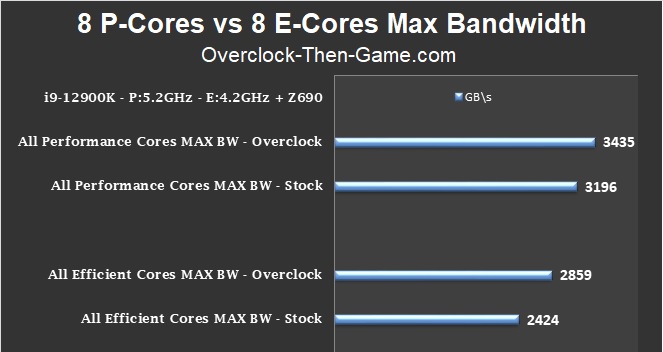
The chart above shows the max performance for all 8 Performance Cores separate from the 8 Efficient Cores. This is a low level test that will show the actual max performance for the cores working on various workloads. Starting with the 8 overclocked Performance Cores we see that I have increased my performance to 3.4 TB\s up from 3.2 TB\s. The actual increase is 239 more GB\s. That’s a lot of extra data that Intel’s Core i9-12900K can crunch. The absolute best case scenario for the ‘overclocked’ P-Core was a whopping 4.8 TB\s. The ‘stock’ P-Core absolute best case scenario was 4.5 TB\s. The actual best case performance increase was 330.4 GB\s. Now we will focus on all 8 overclocked Efficient Cores. I have increased my performance for an average of 2.86 TB\s. That is up from 2.4 TB\s. The actual increase is 435 more GB\s. The Efficient Cores are capable of some serious workloads as well. The low-latency that the Efficient Cores have definitely helps them complete plenty of workloads quickly. The absolute best case scenario for the ‘overclocked’ Efficient Core was 4.2 TB\s. The ‘stock’ best case scenario was 3.9 TB\s. The actual increase is 378.16 more GB\s. Due to the Efficient Cores having much lower latency than the Performance Cores at every cache level the Efficient Cores can outperform the Performance Cores in specific workloads around accessing datasets. For large datasets the Performance Cores access DRAM 97% slower than the Efficient Cores. So for workloads that require a lot of reads from DRAM the Efficient Cores can complete some serious workloads. In a specific benchmark the Efficient Cores were 81% faster than the Performance Cores. However, in every other test the Performance Cores outperform the Efficient Cores. For example a specific benchmark shows the Performance Core outperform the Efficient Core by an amazing 345%. So while the Performance Cores are very powerful the Efficient Cores can still pull their weight in specific scenarios. The overall average in the chart above shows that the 8 ‘overclocked’ Performance Cores is 20% faster than all 8 ‘overclocked’ Efficient Cores. The Performance cores are 576.3 GB\s faster than the Efficient Cores. Now that we have seen the actual increases within the micro-architecture at the lowest levels let’s take a look at higher level synthetic benchmarks.