Deep DiveStock vs Overclocked i9-12900K

Introduction
Alder Lake is a brand new micro-architecture using a big.LITTLE uarch so not all current software will utilize Alder Lake to its full potential. This time around I wanted to take a deep-dive to show the difference between stock and overclocked performance results. This article will show traditional synthetic benchmarks as well as benchmarks that will compare the Alder Lake micro-architecture. My goal remains the same and that is attempting to bypass the current synthetic software limitations and to get the exact performance numbers across the micro-processor. Therefore we will take a look at the stock results and the overclocked results as well as the power consumption.
Alder Lake Stock Info
When all cores are being used the Core i9-12900K default frequency is: Performance Core 4.9Ghz – Efficient Core – 3.7GHz, Ring Freq. 3.6GHz. Alder Lake official DDR5 supported frequency is DDR5-4800Mhz and that is what I am using. Even with stock settings the i9-12900K does very well in actual workloads and synthetic benchmarking. The Ring frequency is actually set to 4.7GHz by default during light workloads or idle periods, but it drops down to 3.6GHz once there is a decent load on the PC. Luckily the Ring can easily be overclocked to 4GHz for many enthusiasts without increasing the voltages. IA is what Intel has been calling their cores for many years: “Intel Architecture”, that would be the Performance Cores and Efficient Cores. The stock vCore for my CPU is around 1.26v and each Alder Lake CPU will have slightly different voltage numbers. This is because each Core or ‘IA’ Core has its own VID. This VID is determined when the core, both P & E core, is created and measured for all of the supported frequencies (P-Cores: 700MHz to 4900MHz or 4.9GHz & E-Cores 700MHz – 3700MHz or 3.7GHz). The Core i9-12900K base frequency is actually 3.2GHz, but Intel Turbo technology allows cores to run higher (P: 4.9GHz\5.2GHz & E: 3.7GHz); so it’s safe to say that these CPUs are already overclocked out of the box like everything else nowadays. From that point the CPU VID will request voltage via the SVID from the motherboard \ VRMs. So each CPU will have various VIDs. I won’t go any deeper than this for now, but now we know enough to speak about the overvolting, overclocking and undervolting.
ADL Overclock Info + LGA1700 Mounting Brackets
Intel definitely pushed the Core i9-12900K to the max and probably pushed a little too far. In my initial review I was able to undervolt the CPU without losing any performance and lowering both power usage and temperature. I went from using the stock voltage, 1.26v, to using only using 1.10v on average (1.10v - 1.15v); getting as low as 1.08v. So while my CPU VID was requesting high voltages it was possible to stabilize and run the CPUs with much lower voltages. This can be accomplished in several ways, but many people will simply lower the V \ F curves (voltage frequency curves). Many 12900K owners realized this and started undervolting their CPU on day one. This makes Alder Lake very efficient across all workloads. Not only was I able to undervolt Alder Lake, I was able to overclock the Efficient Cores from stock 3.7GHz to 4.0GHz as well. This gave me a very nice performance increase and made Alder Lake even more efficient. About a week after undervolting and overclocking the E-Cores I decided to start overclocking the P-Cores. The Performance Cores can quickly add a lot of wattage and let’s not forget my default voltage was 1.26v so going higher than stock frequencies should require more voltage. I quickly learned that I was correct and hit a brick wall. That brick wall was high wattage which leads to higher CPU temperatures which causes throttling; therefore it made no sense to keep pushing higher voltages into my CPU. During that time my LGA1700 mounting brackets were delivered and I installed it while using the included thermal paste. I am using a 360mm radiator AIO as well, but the temps more less remained the same. What made this even more frustrating was that I was only able to go 0.01v above my stock voltage (1.26v) to only 1.27v before the CPU would throttle due to heat. I was hoping to get a bit more out of the CPU. I pushed my CPU to P:5.1GHz(+200), E:4.1Ghz (+100) when I wrote my last overclocking article. Luckily I found an easy solution for better temperatures across the processor and that was to try different thermal pastes to hopefully resolve the problem. So I purchased a different thermal paste and at first nothing appeared to be different and I thought that maybe the thermal paste needed to cure. However, one thing I noticed right away was that when I pushed the CPU voltage (vCore) higher my CPU did not throttle. Success! The heat transfer was definitely better. In the future I might go into more detail comparing various thermal paste and my results. I’ve never benchmarked or compared thermal paste thoroughly so that should be fun. Now with all of that being said I was able to push my CPU voltage (vCore) up to 1.36v in the UEFI\BIOS and while average 92c during benchmarking. This put the CPU wattage at roughly 297 watts. I was able to push my Performance Cores up to 5.2GHz (+300) and run my Efficient Cores @ 4.2GHz (+600) with no stability issues along with DDR5-5600Mhz and the Ring overclocked to 4.0GHz (+300). I will work on possibly lowering the voltage in the future as I continue to learn more about the platform.
Deep Dive Stock vs Overclocked i9-12900K - YouTube Video
Direct Link to Youtube Video - https://www.youtube.com/embed/IHRLQkjsyUk
Specifications

CPU: Intel Core i9-12900K Overclocked to 5.2GHz(P-Core) & 4.2GHz(E-Core) - CPU Ring: 4.0GHz
CPU Cooler: EK AIO 360mm Liquid Cooler
Motherboard: ASUS ROG Strix Z690-F Gaming Wi-Fi [BIOS: 0702]
RAM: 32GB [2x16GB] DDR5-4800Mhz (40-39-39-76) Overclocked to 5600Mhz (40-39-39-76)
PSU: Phanteks 1200W - 80+ Platinum
SSD: 1TB WD BLACK SN850 - 7.0GB\s Read - 5.3GB\s Write - PCIe Gen4 (x4)
SSD: 3TB - 2.7GB\s Read - 2.1GB\s Write
HDD: 6TB - 350MB Read - 330MB\s Write - RAID 0
GPU: EVGA RTX 3080 Ultra Liquid Cooled 240mm - Push
GPU Speed: 1440Mhz
(Stock) –
Core: Mhz (Mhz Boost) - 1845Mhz
GPU vRAM: 10GB
GPU Drivers: Geforce: v497.09 [Nov 16, 2021]
Operating System: Windows 11
Alder Lake Interconnect
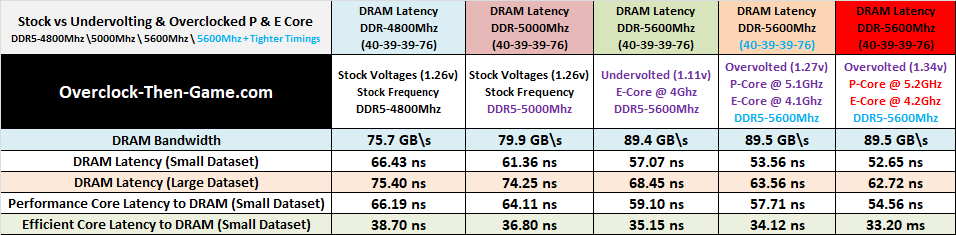
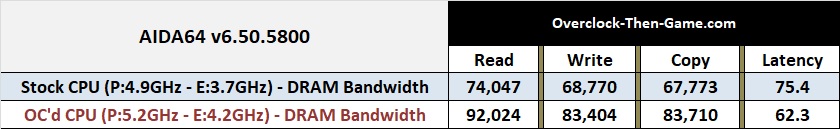
Not much has changed since my last benchmarks (P: 5.1GHz \ E: 4.1GHz) as expected. However, any increase is good in my book. I will be comparing the stock and overclock settings while showing all of my results thus far. Starting with the DRAM Bandwidth I have increased my bandwidth from 75.7 GB\s (DDR5-4800Mhz) to 89.5GB \s (DDR5-5600Mhz) which is an 18.22% increase. DRAM Latency (Small dataset) now shows the latency decrease from (stock) 66.43 ns to 52.65 ns. This is a 23% difference in latency. When it comes to latency lower is better. My DRAM Latency (Large dataset) shows a decrease of 12.68 ns. This makes the stock results 20% slower than my overclock results. Getting the large datasets down to 62.72 ns is great and hopefully I can continue to push the DRAM frequencies further. I have combined the average of all the P-Cores and E-Cores in their respective columns instead of listing each core individually. The Performance Cores shows a decrease of 18% when compared to the stock settings. The Efficient Cores shows a decrease of 15%. The Efficient Cores have always shown great low-latency to DRAM and could lead to some great performance results in future micro-architectures from Intel.
Performance & Efficient Cores
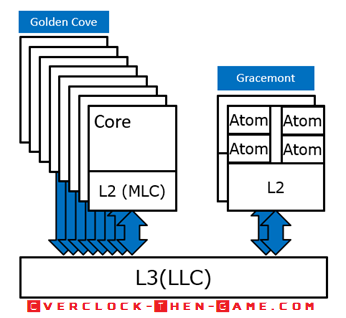
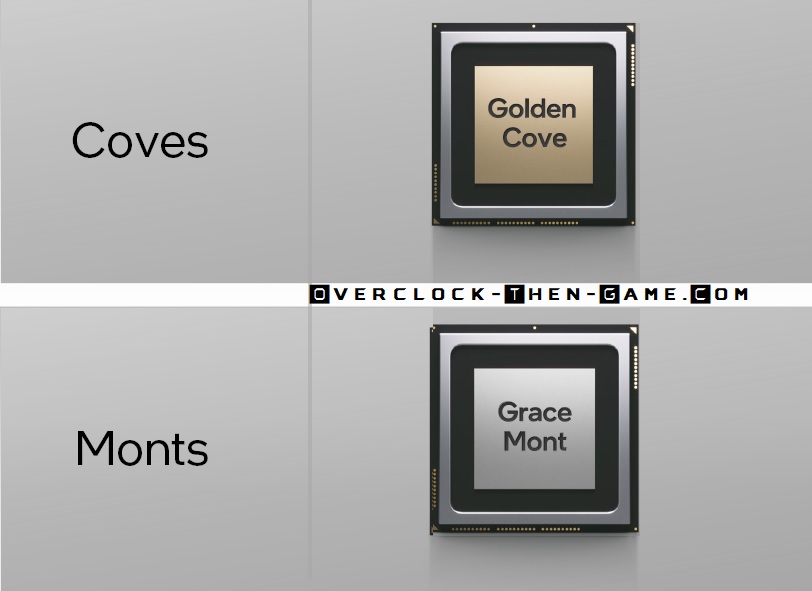
Now that we have seen how much quicker the Intel 12th Generation processor can access and retire data we can now begin to see how those latency decreases apply to actual workloads and benchmarks. Similar to my initial Alder Lake review I will be taking another deep-dive into the micro-architecture. Below we will take a look at the actual performance increases from the “Golden Cove” Performance Cores and “Gracemont” Efficient Cores. There are 8’ Golden Cove’ cores and 8 ‘Gracemont' Cores. The 8 ‘Gracemont’ Efficient Cores are clustered in pairs. So one Efficient Cluster contains only 4 ‘Gracemont’ Efficient Cores and those 4 Efficient Cores share the same L2 Cache. The Efficient Cores are also officially known as 'Atom' Cores. I will be comparing each Cluster individually and I will be comparing both Clusters working together on various workloads. This way we can see exactly how much my overclocks have increased with each Cluster and we will also be able to see how well the Cluster works when it doesn’t need to send data to and from the Performance Cores or the adjacent Cluster. Meaning that latency won’t affect performance as much since the Cluster won’t need to send or wait for other cores (caches and so on) within the micro-architecture.
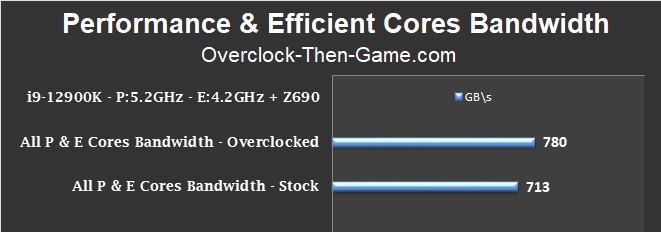
I will start with all of the cores working together on various workloads to show the overall performance increase. The stock frequency under a full CPU load is P: 4.9GHz \ E: 3.7GHz, Ring: 3.7GHz & DDR5-4800Mhz. My overclock results are P: 5.2GHz (+300) \ E: 4.2GHz (+500), Ring: 4.0GHz (+300) & DDR5-5600Mhz (+800). I have increased my overall performance by 67GB\s pushing my previous result of 713 GB\s up to 780 GB\s. That represents an 8% increase in performance and while 8% might not seem like a lot to most people, here we can see that it translates to 67 GB\s. Alder Lake was already capable of handling workloads with no problems, but an extra 67GB\s is very nice.
Performance Cores Bandwidth (8 P-Cores)
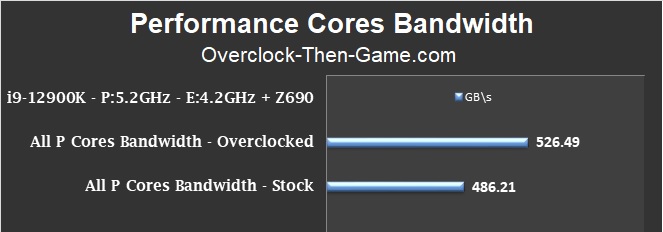
Now just focusing only on 8 Performance Cores we see an increase of 40 GB\s. I was able to increase my performance by 8.3% and my when working together all 8 Performance Cores were capable is moving 526.49 GB\s.
Efficient Cores Bandwidth (8 E-Cores)
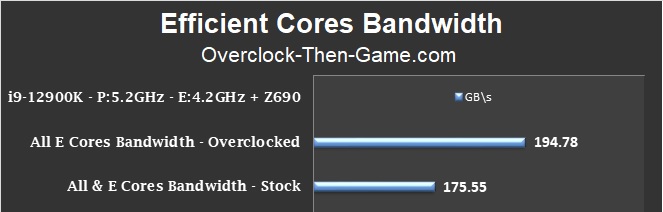
Now we will turn our attention to the overclocked Efficient Cores. With all 8 E-Cores working together I have increased my results by 11%. This is an additional 19.2 GB\s.
Single Efficient Cluster Bandwidth (4 E-Cores)
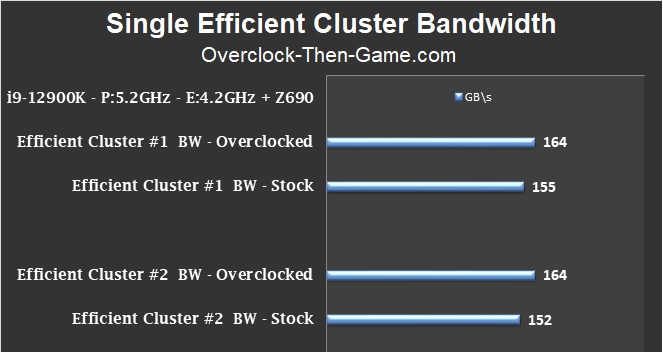
This chart shows each Efficient Core individually. My overclock results show that both Clusters now perform the same. Cluster #1 (x4 E-Cores) performance increased by 9 GB\s. Cluster #2 (x4 E-Cores) performance increased by 12 GB\s. Cluster #2 received the most significant performance increase since it now matches Cluster #1.
Performance Core vs Efficient Core
Once again I will attempt to determine the performance within the actual IA core (L1 Cache, OOE, Execution Units, etc ). I will benchmark the performance of a single Performance “Golden Cove” Core and a single Efficient “Gracemont” Core. You can think of this as a ‘true’ single-core benchmark. It is possible to use many instructions to determine benchmarks and performance outcomes. In these tests I tried to use the most efficient instruction sets as well as different workloads to show the maximum performance within a “Golden Cove” Core and a “Gracemont” Core.
Maximum Single “Golden Cove” Performance
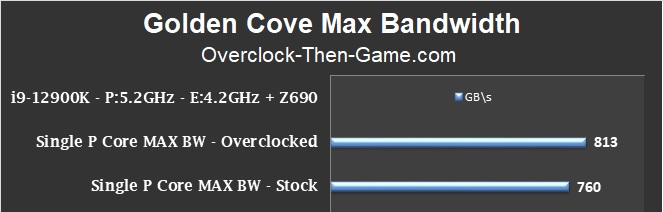
I have increased my average stock results by 53 GB\s pushing my overall bandwidth up to 813 GB\s per core. My absolute best case scenario was 1.1 TB\s meaning that an Alder Lake ‘Golden Cove’ Core is capable of some serious workloads at the micro-architecture level.
Maximum Single “Gracemont” Performance
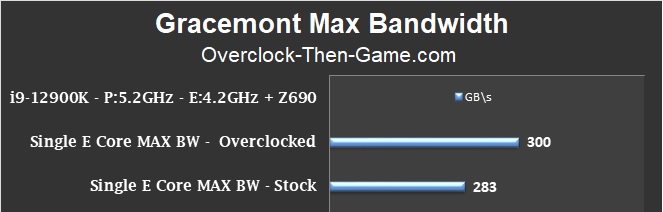
My single overclocked “Gracemont” Core performance has increased by 17 GB\s. My overall benchmarks averaged 300 GB\s and remember that there are 8 total “Gracemont” Cores. My best case scenario for a single overclocked “Gracemont” Core is 480 GB\s compared to only 407 GB\s for the stock results. That is an addition of 73 GB\s (18% increase). We will take a look at all of the Efficient Cores working together below.
Maximum Performance Cores vs Maximum Gracemont Cores
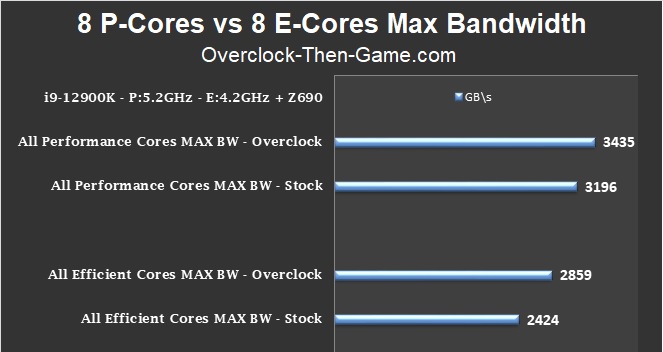
The chart above shows the max performance for all 8 Performance Cores separate from the 8 Efficient Cores. This is a low level test that will show the actual max performance for the cores working on various workloads. Starting with the 8 overclocked Performance Cores we see that I have increased my performance to 3.4 TB\s up from 3.2 TB\s. The actual increase is 239 more GB\s. That’s a lot of extra data that Intel’s Core i9-12900K can crunch. The absolute best case scenario for the ‘overclocked’ P-Core was a whopping 4.8 TB\s. The ‘stock’ P-Core absolute best case scenario was 4.5 TB\s. The actual best case performance increase was 330.4 GB\s. Now we will focus on all 8 overclocked Efficient Cores. I have increased my performance for an average of 2.86 TB\s. That is up from 2.4 TB\s. The actual increase is 435 more GB\s. The Efficient Cores are capable of some serious workloads as well. The low-latency that the Efficient Cores have definitely helps them complete plenty of workloads quickly. The absolute best case scenario for the ‘overclocked’ Efficient Core was 4.2 TB\s. The ‘stock’ best case scenario was 3.9 TB\s. The actual increase is 378.16 more GB\s. Due to the Efficient Cores having much lower latency than the Performance Cores at every cache level the Efficient Cores can outperform the Performance Cores in specific workloads around accessing datasets. For large datasets the Performance Cores access DRAM 97% slower than the Efficient Cores. So for workloads that require a lot of reads from DRAM the Efficient Cores can complete some serious workloads. In a specific benchmark the Efficient Cores were 81% faster than the Performance Cores. However, in every other test the Performance Cores outperform the Efficient Cores. For example a specific benchmark shows the Performance Core outperform the Efficient Core by an amazing 345%. So while the Performance Cores are very powerful the Efficient Cores can still pull their weight in specific scenarios. The overall average in the chart above shows that the 8 ‘overclocked’ Performance Cores is 20% faster than all 8 ‘overclocked’ Efficient Cores. The Performance cores are 576.3 GB\s faster than the Efficient Cores. Now that we have seen the actual increases within the micro-architecture at the lowest levels let’s take a look at higher level synthetic benchmarks.
Synthetic BenchmarksCinebench R23 - 7-zip - AIDA64

Cinebench R23 – Multi-Thread
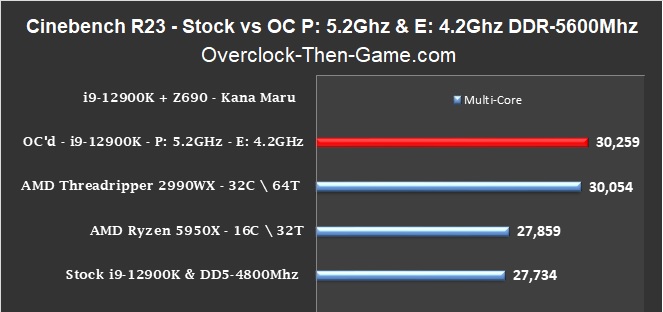
Starting with the Multi-Thread results we see that when compared to the stock i9-12900K + 4800Mhz there is 9% increase in performance. The Cinebench R23 score adds an additional 2,525 for a total of 30,259. The overclocked i9-12900K (5.2GHz) is also nearly 9% faster (8.6%) than the stock AMD Ryzen 5950X in this multi-thread benchmark. Another thing worth noting is that the ‘stock’ i9-12900K (P: 4.9Ghz – E: 3.7GHz + DDR5-4800Mhz) is less than a percent (0.45%) slower than the AMD Ryzen 5950X. This is noteworthy because the Ryzen 5950X is a 16 Core \ 32 Thread and Intel practically matches it with 8 less threads (i9-12900K 16C \ 24 Threads). As of December 2021 the average price of an AMD Ryzen 9 5950X is $773.61 (Ryzen 5950X is sold directly by Amazon for $710). The i9-12900K is sold directly by Amazon for $620. I managed to beat the referenced AMD Threadripper 2990WX – 32 Core \ 64 Thread CPU by 205 points. The Threadripper 2990WX has double the cores and 40 more threads than the i9-12900K (16C \ 24 Threads). As a reminder the the AMD Ryzen Threadripper 2990WX 32-Core \ 64-Thread processor average price on Amazon is $1,878.50 as of December 2021. Amazon is selling the i9-12900K for approximately $620 as of December 2021.
Cinebench R23 – Single-Thread
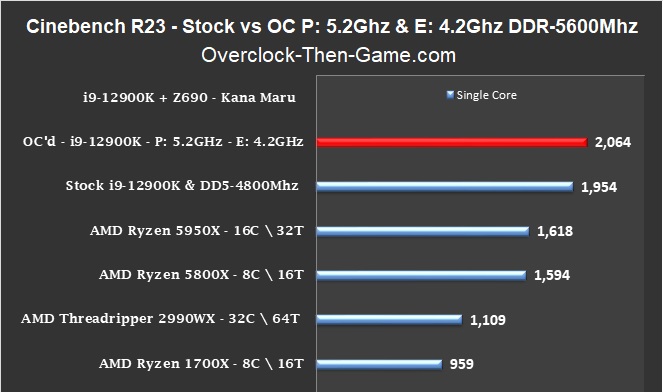
The Cinebench R23 single-thread benchmark shows that I increased my score from 1,954 to 2,064 which is a 6% increase. I overclocked the stock i9-12900K Performance Core from 4.9GHz to 5.2GHz, this is a 6% increase so Cinebench R23 single core results scales nearly perfectly. The overclocked 12900K shows a 28% increase over the stock Ryzen 9 5950X. The ‘stock’ 12900K + DDR5-4800Mhz is 21% faster than the stock Ryzen 9 5950X. The ‘stock’ 12900K is also 30% quicker than the stock Ryzen 9 5800X. The referenced AMD Threadripper 2990WX (32 Core \ 64 Threads) single core is much slower than the overclocked i9-12900K. The ‘stock’ i9-12900K is 76% faster than the AMD Threadripper 2990WX. I decided to throw the 1st Gen AMD Ryzen1700X 8 Core \ 16 Thread on the chart since there were plenty of samples to get a good average. The overclocked 12900K is 115% faster while the stock i9-12900K is 104% faster than the AMD Ryzen 1700X.
7-Zip v19.00
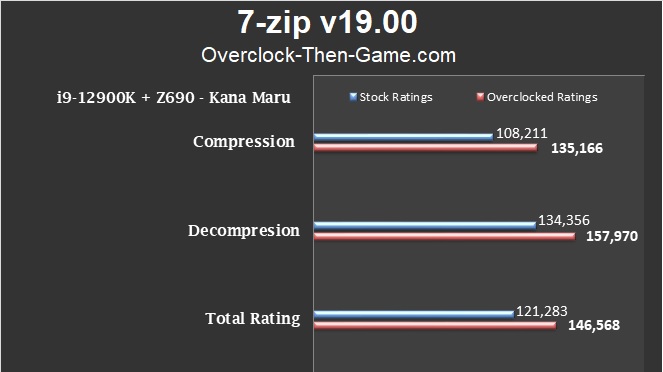
7-zip is a program I use for a lot of different reasons. With my P-Cores @ 5.2GHz, E-Cores @ 4.2GHz, Ring @ 4GHz and DDR5 overclocked to DDR5-5600Mhz I have increased my Compression results by 25% when compared to the stock 12900K. The Decompression results show an 18% increase. The Total Rating results have increased by 21%. This is a really nice increased in performance for only increasing the Performance Cores by 6% and the Efficient Cores by 13.5%.
7-Zip v19.00 - Real Time Benchmark
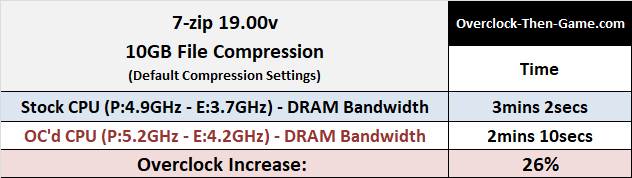
Normally you’ll only see my “Real Time Benchmarks” in my GPU reviews, but I have decided take a file on my PC to validate the performance increase that I achieved in the 7-zip benchmark. Since the decompression is usually very fast regardless of the overclock settings, I decided to focus on the longer workload which is the “Compression” stage when preparing files. I took a 10GB file that consist of 1,317 Folders and also contains 14,159 Files. There are plenty of larger and small files throughout the directory so this should be a great representation of my performance increase during an actual file compression. I used to default 7-zip Compression settings (Compression: Normal, LZMA2, 32MB and so on). That means that my 10GB file will be compressed to only 2.6 GBs. The stock results show that it took 3 minutes and 2 seconds to compress the 10GB file. The overclock settings show that it took only 2 minutes and 10 seconds to compress the same file. This is a 26% performance increase meaning that 7-zip’s benchmark is very accurate. The benchmarks results 25% and I was able to reach 26%. Decompressing the files took roughly 10 secs. So I was able to decompress the 2.6GB file back into a 10GB file within a matter of seconds.
AIDA 64
Synthetic BenchmarksCPU-z - y-cruncher - Corona
CPU-z – Single Thread
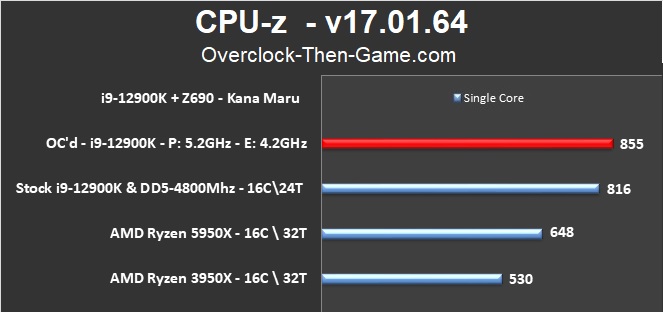
Taking a look at the single-threaded performance shows that the overclocked i9-12900K takes a commanding 32% lead over the reference AMD Ryzen 5950X. The overclocked 12900K beats the reference 3950X by 61%. The overclocked 12900K is 5% faster than the stock 12900K. The ‘stock’ 12900K beats the 5950X by 26% and beats the 3950X by 54%.
CPU-z – Multi Thread
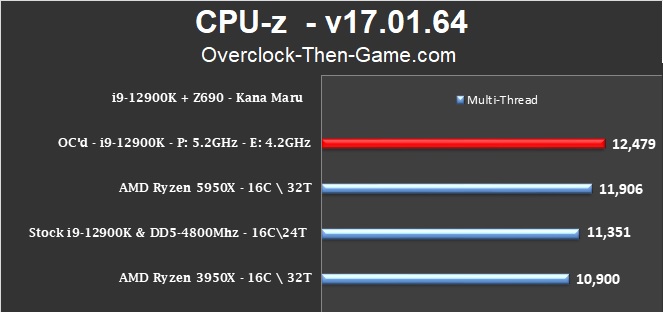
In the CPU-z Multi-Thread benchmark my overclocked i9-12900K managed to beat the referenced AMD Ryzen 9 5950X (16Core \ 32T) by 573 points which is a 5% increase over the 5950X. The 5950X has 8 more threads than the i9-12900K so this was nice achievement to hit. My ‘overclocked’ 12900K beats my ‘stock’ 12900K by 10%. The ‘stock’ 12900K was only 5% slower than the ‘stock’ AMD Ryzen 5950X. However, the stock i9-12900K - 16-Core with only 24-Threads beats the highly threaded 16-Core \ 32-Thread AMD Ryzen 9 3950X by 4%. The average price for a new AMD Ryzen 9 3950X as of December 2021 is $1,203.61 on Amazon. Which makes the Ryzen 9 3950X nearly 100% more expensive than Intel's Core i9-12900K.
y-cruncher v0.7.8 (Build 9507)
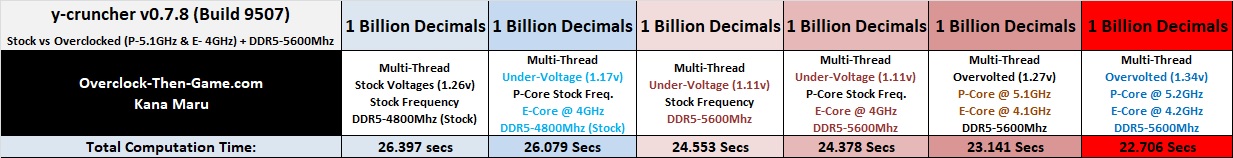
Here is a list of all of my y-cruncher results. The latest result is on the far right and highlighted in red. In y-cruncher I managed to decrease my stock results by 3.256 seconds. The stock results are 14% higher than the overclocked results. In this test ‘lower is better’ so the overclocked i9-12900K can complete the benchmark quicker. This is roughly a 12% performance increase for the overclocked i9-12900K.
Corona 1.3
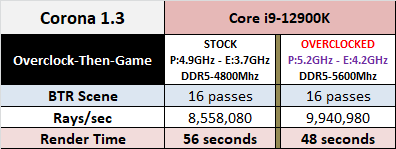
I was able to calculate 1,382,900 more Rays in 16 passes. I was able to accomplish this 8 seconds quicker than the 'stock' i9-12900K. This benchmark shows a 16% performance increase.
Power Consumption & CPU Temps
Power Consumption – CPU 100% Loads – Cinebench R23
In the chart below I have included 3 results and I need to briefly explain ASUS MCE (Multi-Core Enhancements). The stock Core i9-12900K has a CPU Package Power Limit (PL) of 241 Watts and the processor will prevent the CPU Package from exceeding this limit. That means that if you attempt to overvolt or overclock the i9-12900K and go beyond Intel’s built in CPU Package Power Limit 1 (PL1), the processor will limit CPU power consumption to only 241 Watts; thus using less power, limiting high temps and limiting IA Core frequencies. In the ROG UEFI\BIOS ASUS uses a feature that they named MCE (Multi-Core Enhancements) to bypass the PL1 limit. This allows the CPU to exceed the 241 Watt limit and will push the CPU Package Wattage much higher (250Watts – 280 Watts and higher if possible) if the CPU temperatures allow. ASUS MCE is basically overclocking the CPU and if you have a decent CPU cooling solution you will get better gains in performance beyond Intel’s built-in Power Limits. Please do not confuse the CPU Package Wattage with the actual wattage that will be pulled from the wall. My charts shows the wattage that will be pulled from the wall outlet.
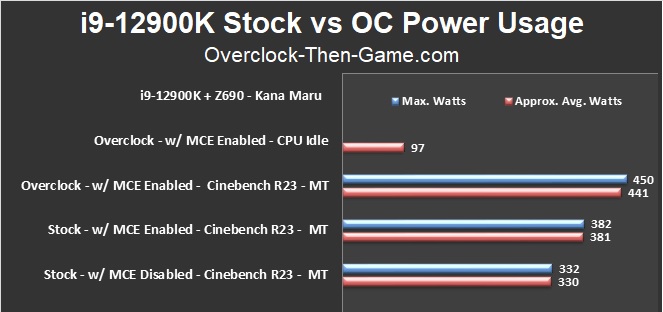
So as we can see in the chart above I have decided to include all of my stock results vs my overclocked results with ASUS MCE Enabled and Disabled for a clearer comparison. As a reminder all of my Power Consumption results are what my PC is pulling from the wall outlet. With Intel’s default power consumption (default Power Limits enabled = ASUS MCE Disabled) I was only using 330 Watts under a full load in Cinebench R23. When disabling Intel’s Power Limit and Enabling ASUS MCE, I was able to exceed the CPU Power Limit 1 limitation (PL1=241W) which will naturally cause me to pull more wattage from the wall on average. With ASUS MCE Enabled I pulled up to 381 Watts from the wall. That is an addition 51 watts on average when the motherboard is allowed to bypass Intel’s CPU Power Limit. Comparing the Stock with MCE Enabled to my Overclocked results with MCE Enabled we see increase 60 watts on average. That is a 16% increase in power consumption with my overclock. However, this isn’t the typical wattage I would use for my overclock. This is only true if you are running 100% CPU loads on the PC with specific workloads. During Idle periods the overclocked 12900K only pulls around 97 watts on average. Intel and ASUS includes many ways to limit power consumption when running higher overclocks to prevent needless overvolting when transition from Idle periods to light workloads such as opening a web browser or basic apps.
CPU Temperature – OC’d CPU 100% Loads – Cinebench R23

Power Consumption – Gaming
For my gaming benchmark results I decided to use a synthetic benchmark and typical in-game benchmark. This should give a decent representation of what to expect for typical gaming power consumptions. I decided to use 1440p to give a better presentation of the CPU and GPU performing in gaming benchmarks. I felt that 1080p would not have stressed the GPU enough since the bottleneck would be the CPU and we already know how much wattage the CPU alone can pull under 100% loads. 4K would have pushed the bottleneck to the GPU and the CPU would not have had to work as hard so 1440p is the middle ground during these benchmarks.
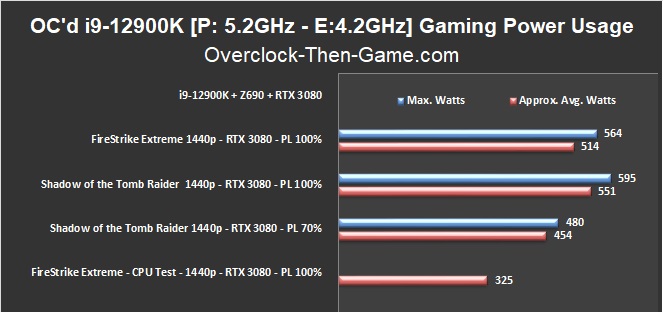
Firestrike Extreme average was 514 Watts across all of the Graphics and Combined benchmarks. I separated the CPU benchmark since the main focus is the CPU and the GPU working together. Shadow of the Tomb Raider @ 1440p shows 551 Watts on average. I lowered the Power Limit down to 70% and only pulled 454 Watts from the wall. That is a reduction of 97 watts. So while the overclocked Power Consumption wattage wasn’t looking so great at first we see that things aren’t that bad since the processor won’t be stressed at 100% during typical gaming sessions. There are many ways to limit power consumption as well on the CPU and GPU. So if you know that you do not need to max out the cores or the Graphic Card for specific workloads and gaming\streaming sessions you can easily limit the power consumption.
CPU Temperature – FireStrike Extreme
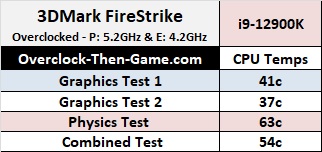
Conclusion & Comments
The Golden Cove and Gracemont cores definitely received some nice increases with the overclocks. When all Performance and all Efficient Cores are working together we saw up to 780 GB a second. Alder Lake is capable of some serious workloads and I will echo what I said in my very first Alder Lake review; if Intel and Microsoft can ensure that certain background workloads can stay within their respective (Efficient) clusters then we could see some amazing performance gains. Using the stock results, we could see up to roughly 308 GB\s being accomplished within the Cluster if both Clusters can work on workloads separately. Overclocked results show up to 328 GB\s. More than enough and we can only imagine how powerful Alder Lake truly is once software developers start optimizing their code for Intel’s Hybrid Technology (i.e big.LITTLE architecture). The Efficient Cores can also access DRAM much quicker than the Performance Cores which makes them great for reading multiple lines of data. Now if the Performance Cores could keep data from being transferred to the Efficient Cores during specific workloads then we could see up to nearly 855 GB\s (P=526 GB\s & E=328 GB\s) across the entire processor. Now just focusing on the stock settings; in the Enterprise environments we will see even more performance with more RAM, different chipsets and more I\O’s. Alder Lake is capable of some serious workloads. Overclocking just makes it that much better. The overclocked 12900K showed some high power consumption results as expected in Cinebench R23, but those results weren’t as bad as I thought they would be. During actual gaming sessions with the GPU included I showed that only 514 Watts were being pulled from the wall outlet on average in 3DMarks’s FireStrike Extreme. The CPU temperature during the FireStrike benchmarks were actually really nice. The Physics test which focuses solely on the CPU only hit 63c. Shadow of the Tomb Raider shows 551 watts during the built in benchmarks which shows different areas of the game. I decided to use 1440p and the “Highest” Preset since it can stress both the CPU & the GPU. To use even less wattage I decided to lower the GPU Power Limit which I suggest many gamers should do if you don’t lose any noticeable performance because you can still enjoy your games while using far less wattage. In my case I lowered my wattage by 97 Watts. When comparing Intel’s Core i9-12900K to AMD’s latest and greatest, the AMD Ryzen 5950X \ 5800X and previous highly threaded “Threadrippers”; Intel’s CPU effectively became the best price for performance. In CPU-Z the i9-12900K is 32% faster than the reference AMD Ryzen 5950X and the Intel i9-12900K is cheaper than the Ryzen 5950X. Intel manages to match AMD's Threadrippers that can nearly reach $2,000.00, but at a much lower price point of only $610.00. These prices are based on Amazon pricing as of December 2021. Even at stock settings the i9-12900K performs very well against AMD’s current processors, overclocking that just add more insult to injury. All eyes are on AMD now and it appears that Intel is ready to follow-up with their 13th Generation “Raptor Lake” processor. Raptor Lake is expected to be a refresh that should allow a “drop in” replacement for current Z690 motherboards. I can’t wait to see what the future brings us. Hopefully the prices stabilize so that I can continue to bring more comparisons across different generations for future Intel and AMD CPUs & platforms. The scariest thing about Alder Lake is that there is still more performance siting on the table and as DDR5 matures we should see even better results. I am now wondering how low the Efficient Cores latency can get when accessing data to and from the DRAM. I have lowered the Efficient Cores DRAM Latency from an already extremely low 38.70 ns to only 33.20 ns. There is potential for more performance that I plan to benchmark as more DRAM modules become affordable and available. Another thing to consider is the “per-core” overclocking features. Enthusiast can now mix and match their settings with Alder Lake. These features were extended from the 10th and 11th Core Generation so Alder Lake gives us many ways to maximize the performance. For example you can run certain P-Cores at 5.3Ghz and other cores at 5.5Ghz. This is possible because each P-Core has its own PLL (phase locked loop). You can also disable Hyper-Threaded per-core if needed. Each Efficient Cluster (4 E-Cores) have to run at the same speed due to all of them sharing the same single PLL. However, you could easily have one Cluster frequency running 4.0GHz and the other Cluster running 4.2GHz or higher. This could lead to some interesting gains if you want to focus on overclocking either the Performance Cores or the Efficient Cores. This could also help stabilize overclocks since voltage and heat will be crucial issues to consider when pushing for high overclocks. This also brings completely new elements to overclocking in the traditional sense. There are many more granular tweaks that you can change per-core or per cluster. This is truly a “hybrid” way to overclock Intel’s Hybrid Technology. I plan to explore these types of overclocks in the future. So with all of that being said Intel has done a solid job with their 12th Gen Alder Lake processor. The Z690 platform appears to have plenty of bandwidth to accommodate the powerful Golden Cores and Gracemont Cores.