Synthetic BenchmarksStock vs Overclocked Results
Now we will take a look at my overclock benchmarks. I have overclocked my Performance Cores to 5.1GHz (+200Mhz), Efficient Cores to 4.1GHz (+400Mhz), the ring bus to 4GHz (+300Mhz) and of course the DDR5 has been pushed up from 4800Mhz to 5600Mhz (+800Mhz). The wattage from the wall outlet can vary depending on what you are running (GPUs, aRGB lighting and fans), but just focusing on the CPU, motherboard and RAM it will pull around 400 watts from the wall when running Cinebench R23 @ 100% with 1.27vCore. Wattage will be much lower for typical workloads and gaming. The CPU Package Wattage was using 260Watts on average with a max of 263 at 1.27v (vCore).
Cinebench R23
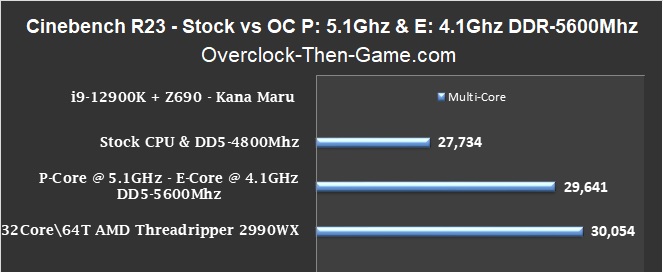
Cinebench R23 shows 29,641. That is a 1,907 score increase over the stock settings of 27,734. Cinebench includes references that you can use and I have included the top result which happens to be AMD’s Threadripper 2990WX – 32 Core \ 64 Thread CPU. My Alder Lake i9-12900K is only a 16 Core \ 24 Threads CPU. The AMD Threadripper has double the cores and 40 more threads over the Intel i9-12900K, but if you overclock the P-Cores to 5.1GHz and E-Cores 4.1GHz with decent DRAM you could possibly come within 1.4% of the Threadripper 2990WX. As of December 2021 the AMD Ryzen Threadripper 2990WX 32-Core \ 64-Thread processor average price on Amazon is $1,878.50.
CPU-z v17.01.64
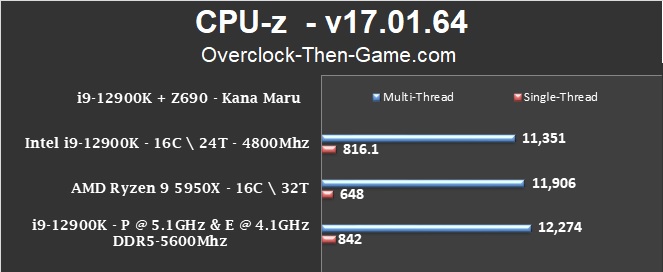
CPU-z includes a stock AMD Ryzen 5950X 16Core \ 32-Thread as a reference. My stock i9-12900K (16C \ 24T) with stock DDR5-4800Mhz DRAM has quicker single-thread performance and comes within 5% of the Ryzen 5950X in multi-thread performance. Slightly overclocking the P-Cores and E-Cores with a decent DDR5 overclock shows the i9-12900K take a commanding 30% increase over the referenced stock AMD Ryzen 5950X in single-thread. With only 24 Threads, the i9-12900K manages to beat the highly threaded (32 Thread) AMD Ryzen 5950X in the multi-threading benchmarks. The i9-12900K edges out with a lead of 369 points
7-zip 19.00v
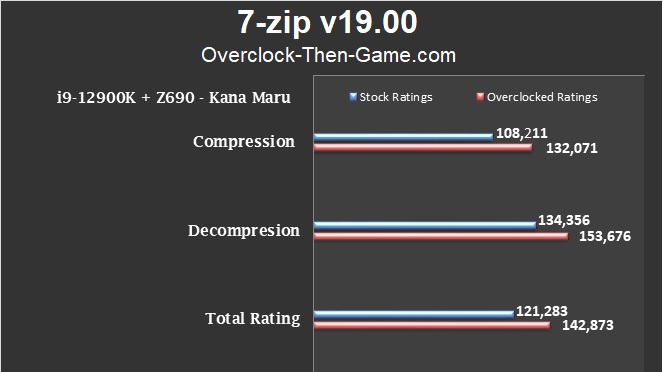
I use 7-zip for a lot of different workloads and it shows some very nice increases with my overclocks. The Compression test shows a 22% increase over the stock settings. The overclocked i9-12900K shows a 23,860 MIPS increase over the stock i9-12900K. The “speed” column increased from 97,773 KB\s to 115,673 KB\s which is a 18% increase. The Decompression results shows a 14.4% increase over the stock settings. That is an additional 19,320 MIPS. The “speed” column increased from 1,510,095 KB\s to 1,727,242 KB\s which is a 14% increase. The Total Ratings for both best comes out to 142,873. That is an increase of 21,590 MIPS which comes out to an 18% increase.
y-cruncher v0.7.8 (Build 9507)
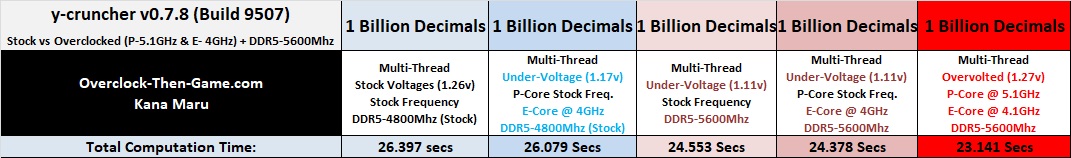
I was able to decrease the stock results (26.397) down to 23.141. That is a reduction of 3.256 seconds which comes out to a decrease of 12%. Lower is better.