Overclocking Alder Lake& Maximizing Performance


Introduction
For the past month or so I have been testing and benching Alder Lake while focusing mostly on lowering the CPU voltage and wattage from the wall outlet. During that time I have managed to hit my goals while increasing performance by overclocking the E-Cores to 4.0GHz and by pushing my DDR5-4800Mhz DRAM up to DDR5-5600Mhz. I have been very conservative with my voltages and overclocks since I still have a lot to learn about the platform. I want to be sure that I am using safe voltages to prevent issues in the future. This time around I am focusing more on overclocking the Performance Cores and tightening different timings with the DDR5 modules.
Overclocking & Limitations
Overclocking isn’t as straight forward as I was hoping it would be, but I expected nothing less coming from the X58 OC era. I am taking different approaches while overclocking Alder Lake. In my previous reviews I took deep-dives in to the micro-architecture while lifting various bottlenecks. The same will happen in this article as I try to tackle different areas of the SoC. In this article I will share the results of my benchmarks and describe a few limitations. The obvious limitation is heat. Voltage and heat will definitely be something to worry about if you are planning on overclocking Alder Lake or any CPU. If you follow Intel’s specifications Alder Lake will begin to throttle at 241 Watts to keep temperature and power usage in check. This can be disabled in the motherboard UEFI\BIOS and from that point you can push Alder Lake’s CPU Package wattage well past 340 Watts if you choose to. Even then if your CPU cooling solution can’t handle the additional heat Alder Lake will lower the core frequencies once the CPU Package temperature gets near 100c. This feature can be disabled as well, but I have no plans to run Intel’s 12th Gen beyond 100c.
Overclocking Alder Lake & Maximizing Performance - YouTube Video
Specifications
So you have to worry about three main things: CPU Package wattage, CPU Package temps and various voltages on the processor. However, there are other temps and areas on the processor to worry about (Ring\System Agent\Power Limits & Thermals and so on). I found my limit and focused on maximizing my performance. I was able to overclock the P-Cores (5.1GHz) and E-Cores (4.1GHz) to certain reasonable frequencies based on my voltages. I continued to run my DDR5 DIMMs @ 5600Mhz with the main timings (40-39-39-72 2T), but I tweaked many of the extended timings. I will be taking a deep dive into the Alder Lake micro-architecture latencies as well to show my continued progress.
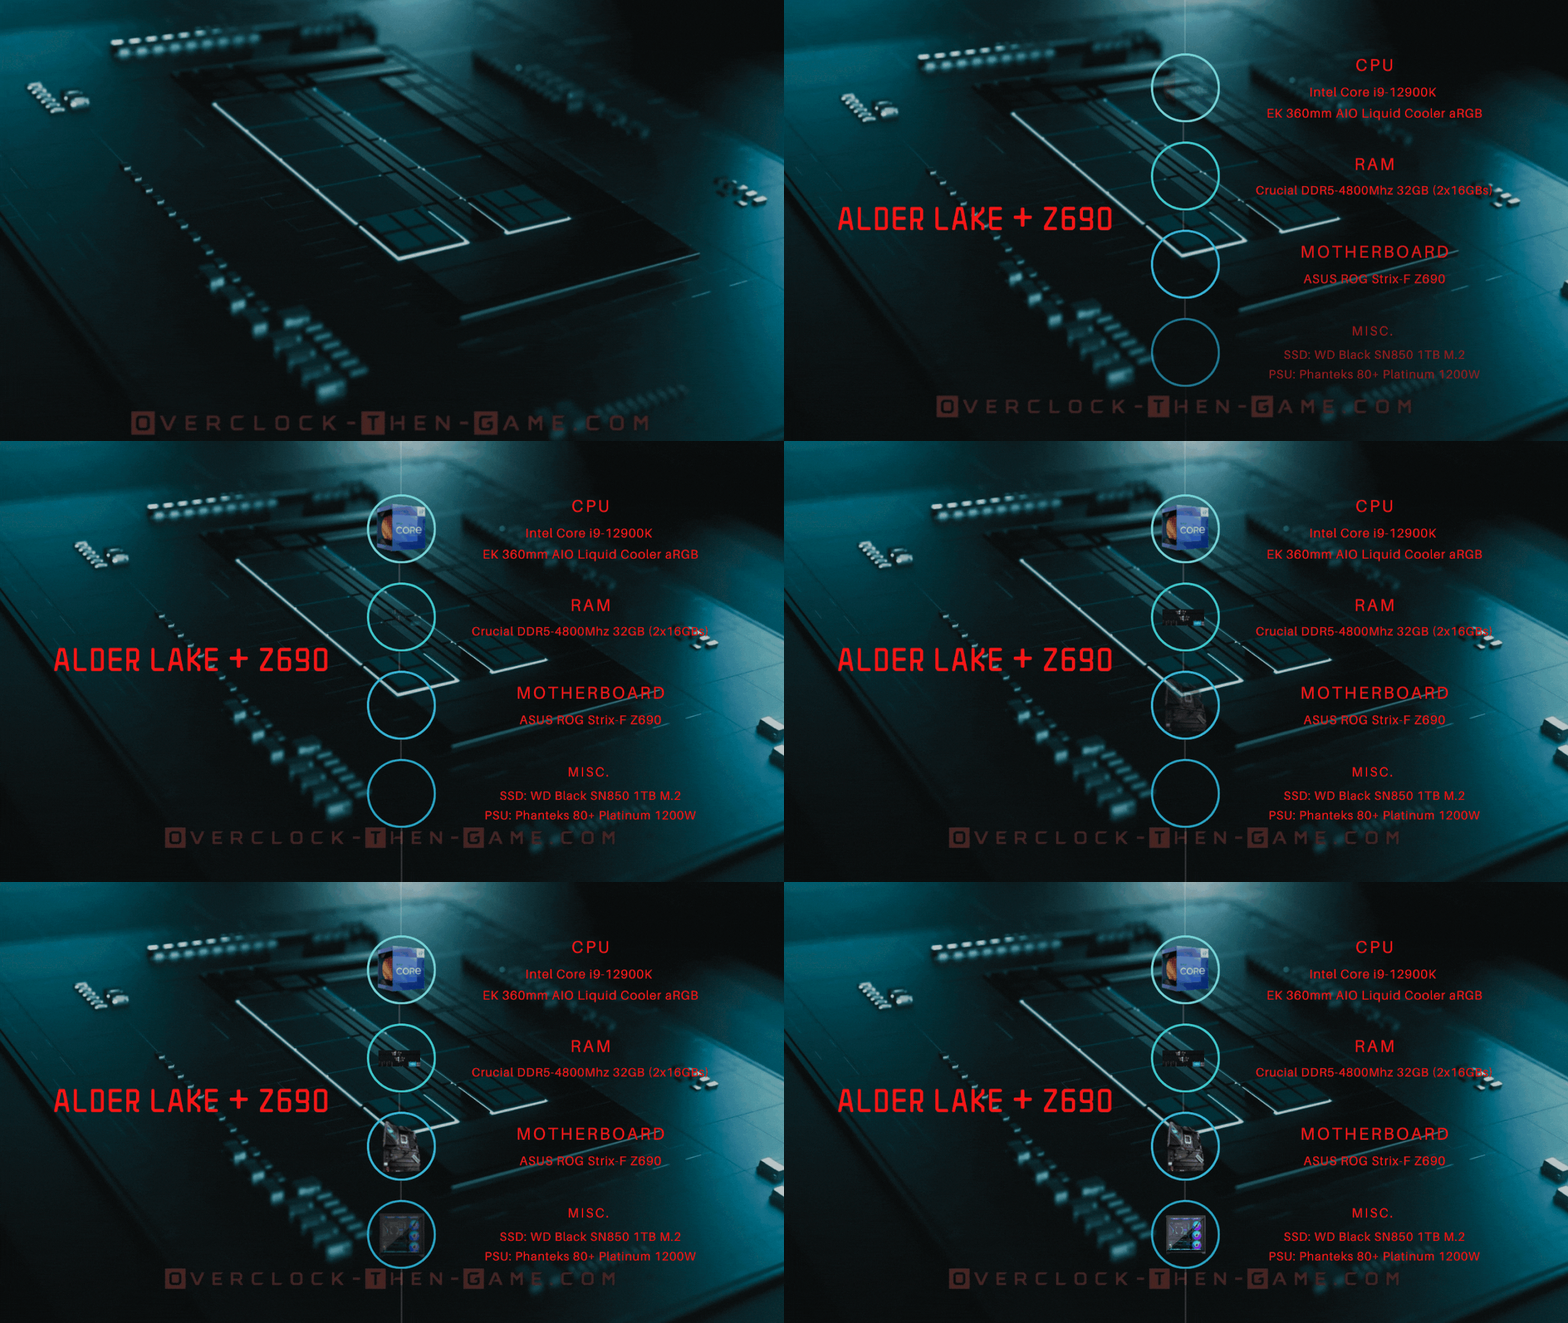
CPU: Intel Core i9-12900K Overclocked to 5.1GHz(P-Core) & 4.1GHz(E-Core) - CPU Ring: 4.0GHz
CPU Cooler: EK AIO 360mm Liquid Cooler
Motherboard: ASUS ROG Strix Z690-F Gaming Wi-Fi [BIOS: 0702]
RAM: 32GB [2x16GB] DDR5-4800Mhz (40-39-39-76) Overclocked to 5600Mhz (40-39-39-76)
PSU: Phanteks 1200W - 80+ Platinum
SSD: 1TB WD BLACK SN850 - 7.0GB\s Read - 5.3GB\s Write - PCIe Gen4 (x4)
SSD: 3TB - 2.7GB\s Read - 2.1GB\s Write
HDD: 6TB - 350MB Read - 330MB\s Write - RAID 0
GPU: EVGA RTX 3080 Ultra Liquid Cooled 240mm - Push
GPU Speed: 1440Mhz
(Stock) –
Core: Mhz (Mhz Boost) - 1845Mhz
GPU vRAM: 10GB
GPU Drivers: Geforce: v497.09 [Nov 16, 2021]
Operating System: Windows 11
Alder Lake-S micro-architecture & DRAM Latencies
In my previous article I included a chart that showed the stock CPU and DRAM frequencies with various overclocks to the Efficient Cores and the DRAM. Shortly after that article was posted I was able to lower my latencies across the entire platform even further through various DRAM timings. I did not update or write another article regarding my performance increases since I quickly shifted to overclocking the Alder Lake processor. So I decided to run all of the latency benchmarks again with my CPU overclocks in the chart below. DRAM is a very important factor in determining and increasing performance for me personally. While trying to find a balance I like to start with DRAM first then tackle other areas on the processor to overclock. I have overclocked the Performance Cores (5.1GHz) and Efficient Cores (4.1GHz) while tightening the extended DRAM timings. I have also overclocked the Ring Bus to 4.0GHz. So while the chart will show that “ (40-39-39-76: 2T) “ for the DRAM, the extended timings have been tweaked and trust me there are many timings to tweak. So now let’s take a look at the micro-architecture latencies.

Starting with the DRAM Bandwidth I have increased my bandwidth from 75.7 GB\s (DDR5-4800Mhz) to 89.5GB \s (DDR5-5600Mhz + tight extended timings) which is an 18.22% increase. In my previous article you can see that I hit 89.4 GB\s and now I have managed to increase that to 89.5 GB\s this time around. Moving down to the “DRAM Latency (Small dataset)” column we see the latency decrease from 66.43 ns to 53.56 ns. That is a 21% difference in latency. I was able to lower that latency from my previous DDR5-5600 overclock in the last article (57.07 ns) to 53.56 ns with tighter extended timings. This is roughly 6% to 7% performance increase and remember when it comes to latency lower is better. Now looking at the larger datasets in DRAM we see a very nice decrease from the stock results (75.40 ns – 4800MHz) down to only 63.56 ns on average. From stock results to my current DDR5-5600Mhz results that is an extremely nice decrease of 11.84 ns. That is a 19% difference in latency. Continuing with the larger datasets (Large DRAM dataset); comparing my latest results to my previous DDR5-5600Mhz (E-Core @4.0GHz) results we see a decrease from 68.45 ns to only 63.56 ns. That is an additional decrease of nearly 5.0 ns over my previous article which is incredible for large datasets in memory. I was not expecting this big of a performance increase by overclocked the DDR5-4800Mhz DRAM especially since its First Gen DDR5. I have combined the average of all the P-Cores and E-Cores in their respective columns instead of listing each core individually this time around. The Performance Cores shows a decrease of 13% when compared to the stock settings. The Efficient Cores shows a decrease of 12%. The Efficient Cores have always shown great low-latency to DRAM and could lead to some great performance results in future micro-architectures from Intel. Now that we have seen how much performance I have gained over the past few weeks let’s see how well my overclocks perform in various synthetic benchmarks.
Synthetic BenchmarksStock vs Overclocked Results
Now we will take a look at my overclock benchmarks. I have overclocked my Performance Cores to 5.1GHz (+200Mhz), Efficient Cores to 4.1GHz (+400Mhz), the ring bus to 4GHz (+300Mhz) and of course the DDR5 has been pushed up from 4800Mhz to 5600Mhz (+800Mhz). The wattage from the wall outlet can vary depending on what you are running (GPUs, aRGB lighting and fans), but just focusing on the CPU, motherboard and RAM it will pull around 400 watts from the wall when running Cinebench R23 @ 100% with 1.27vCore. Wattage will be much lower for typical workloads and gaming. The CPU Package Wattage was using 260Watts on average with a max of 263 at 1.27v (vCore).
Cinebench R23
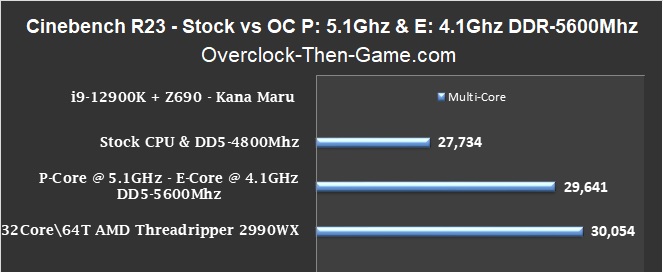
Cinebench R23 shows 29,641. That is a 1,907 score increase over the stock settings of 27,734. Cinebench includes references that you can use and I have included the top result which happens to be AMD’s Threadripper 2990WX – 32 Core \ 64 Thread CPU. My Alder Lake i9-12900K is only a 16 Core \ 24 Threads CPU. The AMD Threadripper has double the cores and 40 more threads over the Intel i9-12900K, but if you overclock the P-Cores to 5.1GHz and E-Cores 4.1GHz with decent DRAM you could possibly come within 1.4% of the Threadripper 2990WX. As of December 2021 the AMD Ryzen Threadripper 2990WX 32-Core \ 64-Thread processor average price on Amazon is $1,878.50.
CPU-z v17.01.64
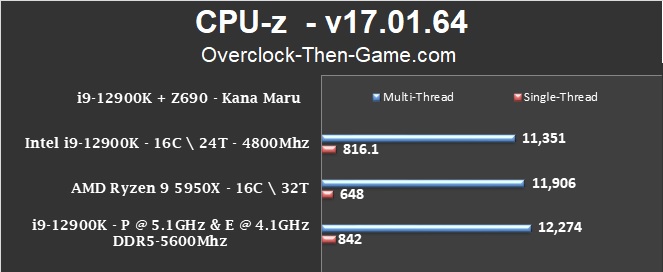
CPU-z includes a stock AMD Ryzen 5950X 16Core \ 32-Thread as a reference. My stock i9-12900K (16C \ 24T) with stock DDR5-4800Mhz DRAM has quicker single-thread performance and comes within 5% of the Ryzen 5950X in multi-thread performance. Slightly overclocking the P-Cores and E-Cores with a decent DDR5 overclock shows the i9-12900K take a commanding 30% increase over the referenced stock AMD Ryzen 5950X in single-thread. With only 24 Threads, the i9-12900K manages to beat the highly threaded (32 Thread) AMD Ryzen 5950X in the multi-threading benchmarks. The i9-12900K edges out with a lead of 369 points
7-zip 19.00v
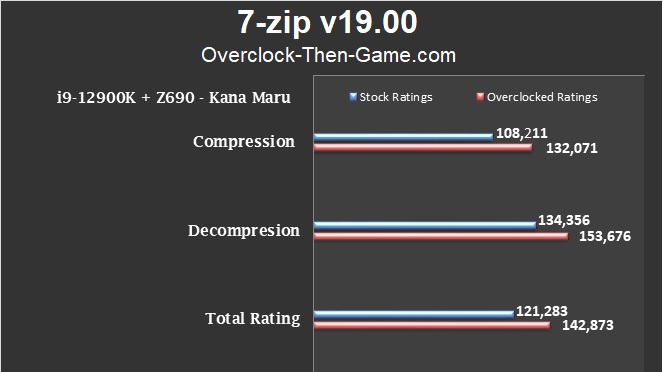
I use 7-zip for a lot of different workloads and it shows some very nice increases with my overclocks. The Compression test shows a 22% increase over the stock settings. The overclocked i9-12900K shows a 23,860 MIPS increase over the stock i9-12900K. The “speed” column increased from 97,773 KB\s to 115,673 KB\s which is a 18% increase. The Decompression results shows a 14.4% increase over the stock settings. That is an additional 19,320 MIPS. The “speed” column increased from 1,510,095 KB\s to 1,727,242 KB\s which is a 14% increase. The Total Ratings for both best comes out to 142,873. That is an increase of 21,590 MIPS which comes out to an 18% increase.
y-cruncher v0.7.8 (Build 9507)

I was able to decrease the stock results (26.397) down to 23.141. That is a reduction of 3.256 seconds which comes out to a decrease of 12%. Lower is better.
Conclusion & Comments
So roughly 1 month after building my Alder Lake PC build I am impressed with what I am seeing from Intel. The 12th Generation Processor is very efficient at stock setting and can easily be undervolted for better temperatures and power consumption. In this article I tackled overclocking the CPU and DRAM. Overclocking the CPU isn’t as straight forward as cranking up voltages and hoping for the best. Those days are over since there are so many different areas on the SoC and certain areas share the same voltage lines. So my methodology has changed a little. While I do plan on pushing Alder Lake further with overclocks I am taking my time since I do not want to over-volt and possibly degrade the CPU or damage the DRAM. My goal is to maximize performance as I continue to overclock, but simply relying on the highest core frequencies doesn’t always mean you’ll gain the best performance. Or it could mean that those performance gains come with astronomical wattage being pulled from the wall and very high heat. Speaking of heat, as you increase the CPU Package Wattage and voltage the heat will become a problem. You need to have a really good CPU cooling solution if you are planning on overvolting\overclocking Alder Lake to high frequencies. Otherwise the CPU will throttle and performance won’t increase regardless of what crazy frequencies are set in the UEFI\BIOS. I found my limit and I had to decide if I wanted to push my CPU temps about the recommended 100 Celsius limit from Intel. I decided to stay below the 100c limit at the moment since this CPU is already powerful and can be very efficient. However, in future articles I would like to take deep-dives into the wattage and VRM performance on the motherboard. I would like a closer look at what is going on and possibly find ways to keep temperature and wattage lower at higher frequencies. This type of deep-dive would also help me understand the motherboard’s UEFI settings more by actually seeing what’s happening in real-time with the voltages. Right now at this moment the Alder Lake CPU is performing very well for going very slightly above stock voltage (1.26v-Stock to 1.27v-Overclocked). I am using a 360mm AIO and Intel has definitely pushed this CPU to its limits. As mentioned previously my limit right now is the heat output and throttling. It makes no sense for me to keep pushing voltages if the CPU will simply throttle and lower the clock frequencies due to heat. This gives me opportunities to find other areas to increase performance that can lead to noticeable benchmark increase and increases in typical workloads. As I continue to overclock with high frequencies I plan to hopefully use the lowest voltages possible. I will continue to publish my benchmarks and tests as I complete them so be sure to check back in the future.
Thank you for reading my "Overclocking Alder Lake & Maximizing Performance" article. Feel free to leave a comment below and feel free to share this article. Be sure to check out the Discord Server as well. If you would like to see more content like this please consider donating to my Patreon or PayPal by clicking the images below. Thank you.

