FURY X OC
Let's see how a limited Fury X core overclock performs
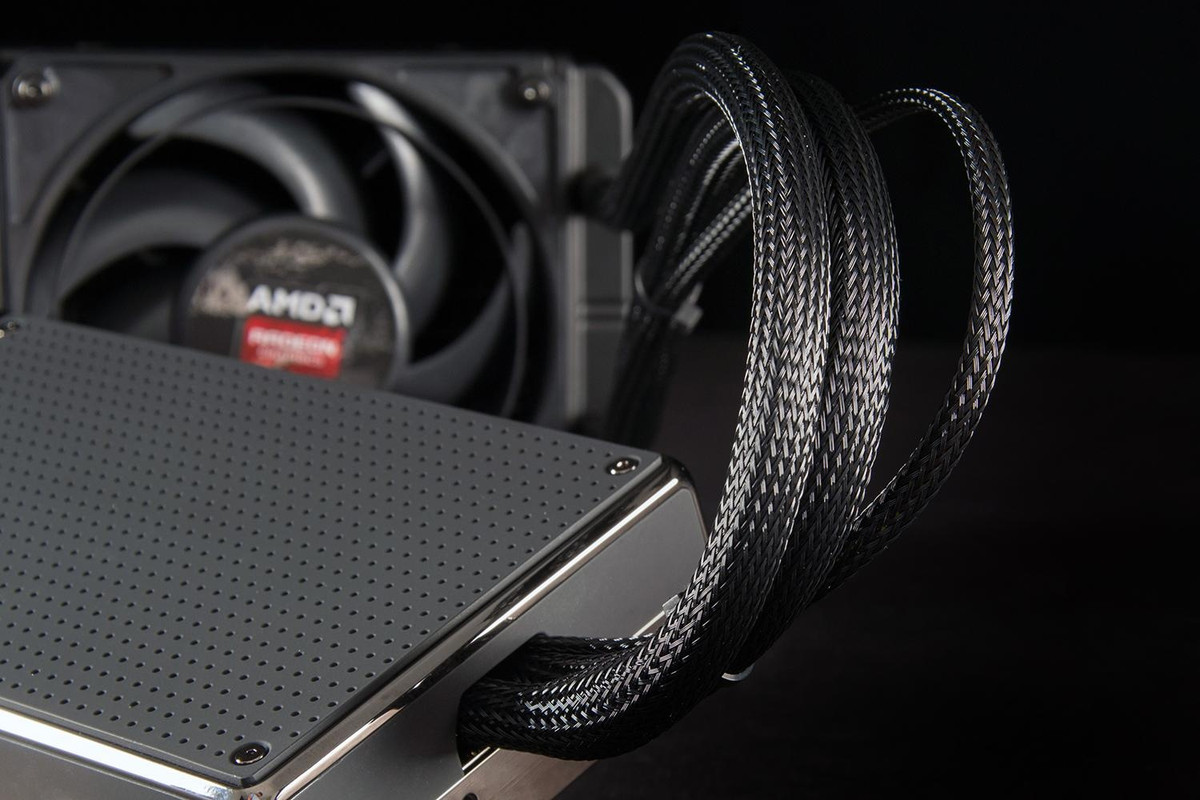
I’ve finally had more time to overclock and run a few synthetic benchmarks. There isn’t much room for overlocking since AMD has these cards locked down pretty tight. HBM is currently locked and can’t be overlocked, but some gamers have found ways to bypass this limitation. The core voltage is also locked and the power target can only be increased up to 50%.
I’m hoping AMD unlocks the Fury X soon and I’m sure they locked it down so people wouldn’t start overclocking the heck out of these cards on day 1. That could lead to a lot of complaints and damage. Overclocking is just one issue that people talk about when comparing the Fury X to the 980 Ti. I will show the Fury X overclock results and then compare the OC Fury X results to the 980 Ti overclock results with another X58 user. I will also focus on the Graphic and Combined score.
So despite the Fury X OC limitations, I was able to overclock to 1125Mhz on the core. That’s a 7.14% increase over the stock settings. I’m not sure how stable the overclock is, but I’m simply running synthetic benchmarks so hopefully everything is stable in the future I'm used to overclocking much higher with previous GPUs. However, The Fury X can maintain it's max core clock easily without performance issues or downclocking due to heat.
3DMark Fire Strike Performance

Performance [Core 1125Mhz]: 15,750
4.5% increase over the Fury X stock results. 667 point increase for a minor core clock increase.
3DMark Fire Strike Extreme
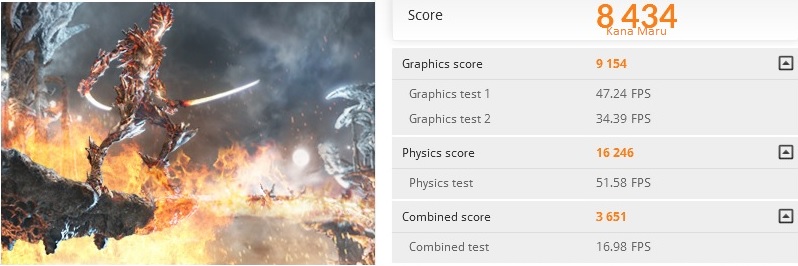
Extreme: 8,434
This is a 5.2% increase over the Fury X stock results.
3DMark Fire Strike Ultra

Ultra: 4,581
This is a 5% increase over the Fury X stock results.
3DMark Future Test - API Overhead DX12
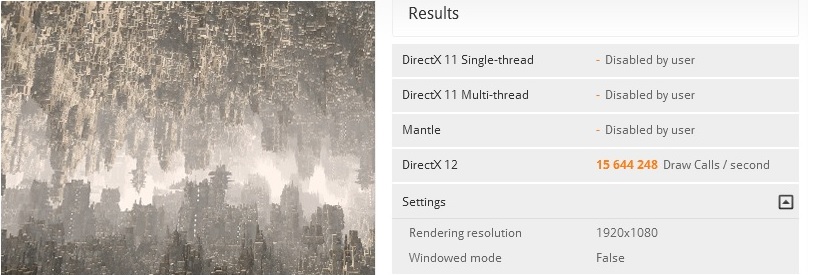
DX12 Feature Test: 15,644,248
This is a 3% increase over the Fury X stock results.
3DMark 11- Performance
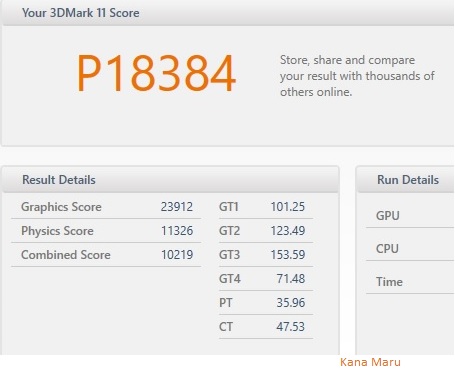
3DMark 11 Performance: 18,384
This is a 3% increase over the Fury X stock results.
3DMark 11 - Extreme
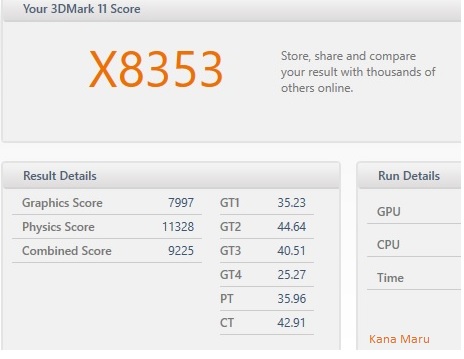
3DMark 11 Extreme: 8,353
This is a 5% increase over the Fury X stock results.
I only slightly bumped up the core frequency and leaving everything else to default settings. The increase was decent. On the next page I will be comparing stock and overclocked X58-Fury X vs X99-980 Ti.