AMD Fury X 2020 - Kana's FineWine Edition
Comments

Introduction
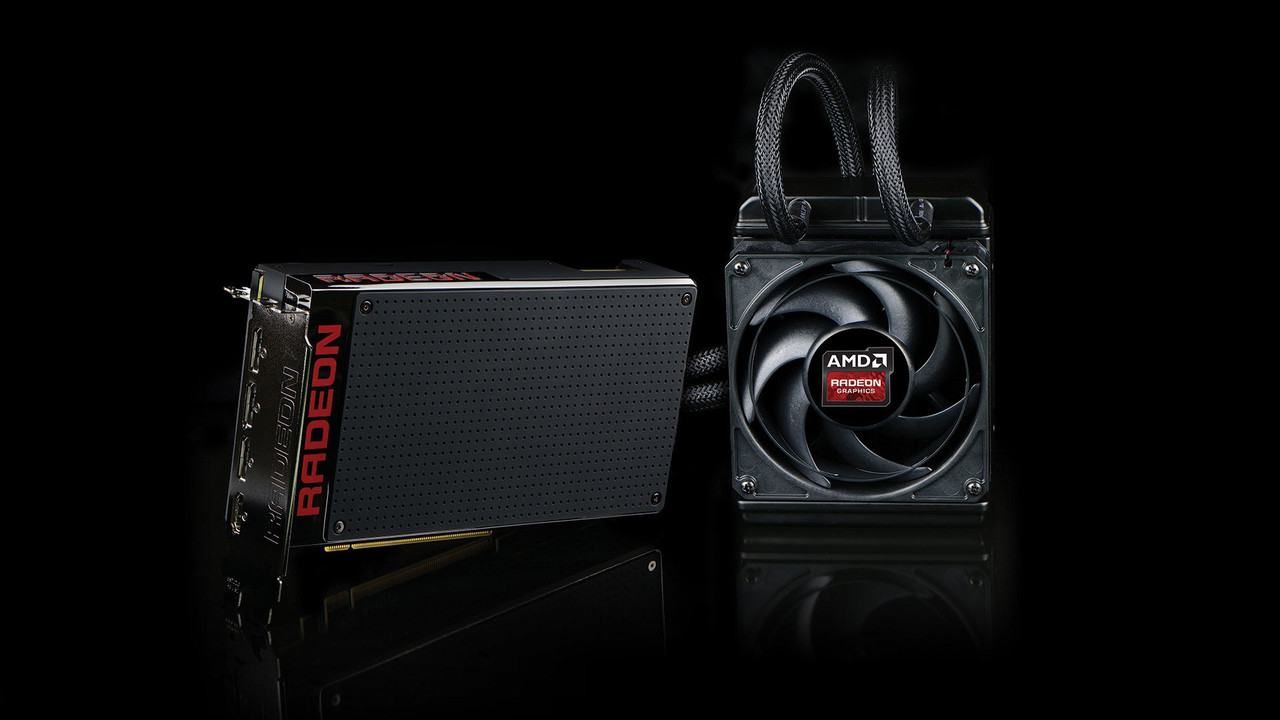
During a fierce battle for the GPU crown a much smaller company, AMD, prepares to release the Radeon Fury X. Never failing to rain on a sunny day parade, Nvidia releases the GTX 980 Ti two weeks before the Fury X in an attempt to undercut any hype for AMD. The hype train was off the rails for both companies during these times. This was a huge deal for AMD because not only were they reviving the Fury brand name, they were also releasing a new technology called “HBM” - High Bandwidth Memory. In my opinion HBM was a game changer and one of the major deciding factors during my decision between the 980 Ti and the Fury X. The raw performance numbers looked breathtaking. During this time AMD was trying to re-build trust from enthusiast while fighting several battles at once against Intel & Nvidia. AMD also promised to focus more on driver related issues and to update drivers more often. I took them to their word and they have delivered on several occasions. Nearly every new game released over the past 5 years either has drivers ready or promptly available after release.
It feels like it was just yesterday when I was undervolting and underclocking my Fury X while still getting well over 60FPS in Doom (2016) @ 4K with "Nightmare" graphical settings. Time flies and nearly 5 years after the Fury X release I am still running my Fury X and enjoying the latest and greatest games. It has been 4 years since my last Fury X Review which you can read by clicking here.AMD FineWine keeps getting better and better. That doesn’t mean that the card wasn’t great on Day 1. I enjoyed the heck out of this GPU every year since I first purchased it in 2015. The fact that I can still play several newer games in 4K with near maxed out settings in 2020 is amazing in my honest opinion. I’m also using a 12 year old platform, Intel X58, to perform the benchmarks. While I might not have the latest and greatest tech my workstation\gaming rig is still capable.
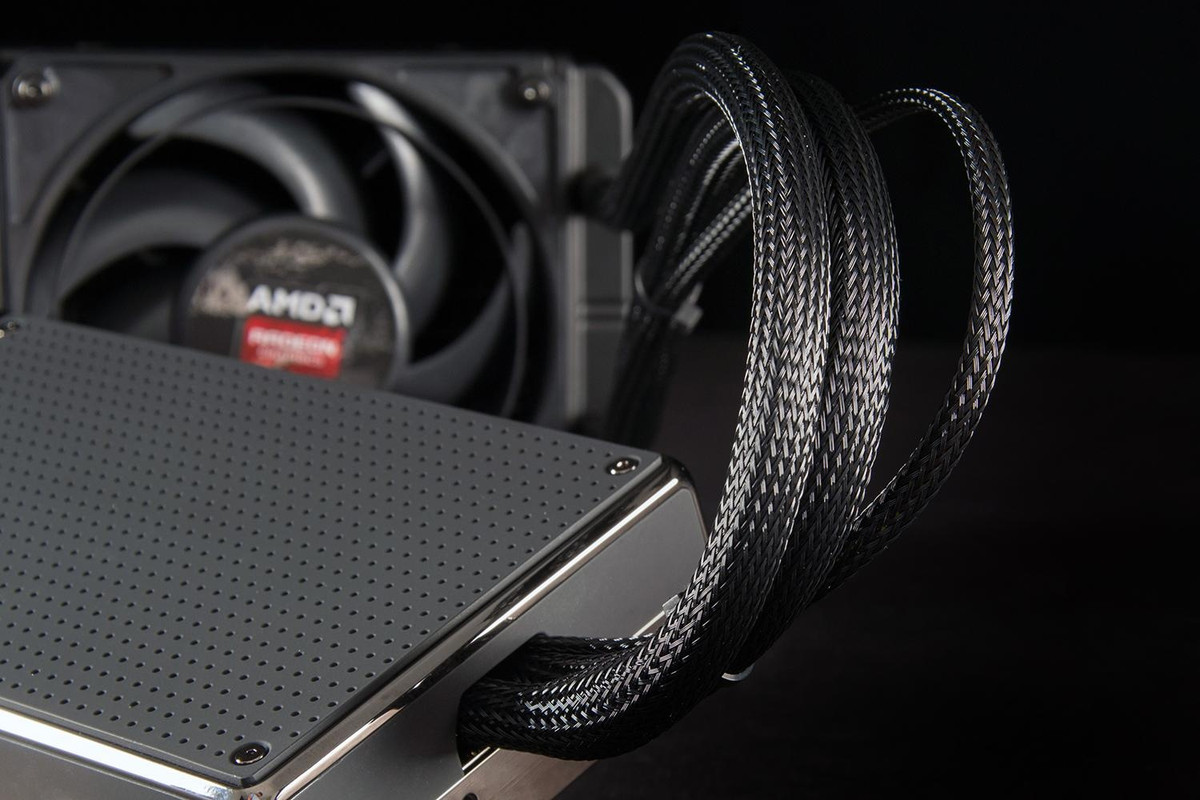
Many years ago I would say something along the lines of “I don’t know what AMD did with the Fury X, but I am simply amazed”. When I stated that it was because I amazed at how well the Fury X handled 1440p and 4K games back in 2015-2016 with ease. The experience has been great with little to no screen tearing when pushed to its limits. You would think that the HBM 4GB buffer would make the card succumb to games using well above 6GBs vRAM in 2015\2016 @ 4K & or 12GBs in 2019 (RE2 Textures), but no the games run fine overall. Going beyond the vRAM limitation can and will obviously cause issues at high resolutions such as 4K, but at 1440p the Fury X can handle games that I play.
So here we are in 2020 and I’ve decided to break out the charts and dedicate a large portion of my time to benchmarking. Unfortunately the world is dealing with the Coronavirus-COVID-19 and I hope we find a cure and get pass this soon. I have been in quarantine for weeks and needed to find different things to do in order to get my mind off of everything going on in the world for a few moments. Why not do something I love? That is IT, computers, gaming, writing and benchmarking.
I am looking forward to what Nvidia and AMD brings to the market later this year. Intel is apparently planning to release a discrete GPU as well, but we will see how that works out for them. The high-end has been pretty one sided for many years now and I have been in the shadows looking on as AMD rebounds & grow while Nvidia continued to profit. Hopefully AMD’s Navi gives Nvidia’s Ampere a run for its money to even up the odds. It would be nice if the GPU prices on both sides could lower with more competition, but I’m not holding my breath. Gamers have made a clear statement, $1000.00 and more for high-end GPUs are normal and have been for some time now.
With all of that being said let’s get to it.
Gaming Rig Specs:
CPU:
Xeon X5660 @ 4Ghz
Motherboard: ASUS Sabertooth X58
RAM: 24GB RDIMM DDR3-1600Mhz [6x4GB] - ECC Buffered
SSD NVMe: 3TB - 2.7GB\s Read - 2.1GB\s Write
SSD NVMe: 256GB - 1.4GB\s Read - 600MB\s Write
SSD(x2): 256GB - 550MB\s Read - 500MB\s Write - RAID 0
HDD(x2): 2TB - 330MB Read - 320MB\s Write - RAID 0
HDD(x2): 2TB - 330MB Read - 320MB\s Write - RAID 0
PSU: EVGA SuperNOVA G2 1300W 80+ GOLD
GPU:
AMD Radeon R9 Fury X Watercooled - Push
GPU Drivers: Radeon "Adrenalin
" 20.4.2 [April 21st 2020]
GPU Speed:
(Stock) –
Core 1050Mhz
Real Time Benchmarks ™
Real Time Benchmarks™ is something I came up with to differentiate my actual in-game benchmarks from the built-in standalone benchmarks tools. Sometimes in-game - Internal benchmark tools doesn't provide enough information. I gather data and I use 4 different methods to ensure the frame rates are correct for comparison. This way of benchmarking takes a while, but it is worth it in the end. This is the least I can do for the gaming community and users who are wondering if the Fury X can still play newly released titles in 2020. I have been performing Real-Time Benchmarks ™for about 7 years now and I plan to continue providing additional data instead of depending solely on the Internal Benchmak Tools.
-What is FPS Min Caliber?-
You’ll notice something named “FPS Min Caliber”. Basically FPS Min Caliber is something I came up to differentiate between FPS absolute minimum which could simply be a point during gameplay when data is loading, saving, uploading etc. The FPS Min Caliber™ is basically my way of letting you know lowest FPS average you’ll see during gameplay. The minimum fps [FPS min] can be very misleading. FPS min is what you'll encounter only 0.1% during your playtime and most times you won’t even notice it. Obviously the average FPS and Frame Time is what you'll encounter 99% of your playtime.
-What is FPS Max Caliber?-
FPS Max Caliber uses the same type of thinking when explaining the MAX FPS. Instead of focusing on the highest max frame you'll only see 0.1% of the time I've included the FPS max FPS you can expect to see during actual gameplay.
With that being said I will still include both the Minimum FPS and the Max FPS. I just thought I would let you enthusiast know what to expect while reading my benchmark numbers.
AMD FineWine
Resident Evil 2
I have decided to start my AMD FineWine 2020 benchmark review off with a fairly recent released game named Resident Evil 2. RE2 was one of the biggest surprises and one of the biggest releases of 2019. Let me tell you that when I saw the RE2 reveal trailer I just knew my Fury X would probably explode. Well to my biggest surprise I was actually able to run the game very well, even at 4K. I was able to run the game with no major issues at 1080p and 1440p with 100% max settings. Just to put that in perspective that would be approx. 14GBs of vRAM that is required. My Fury X only has 4GBs.
I have played RE2 using Radeon VII on a 4K OLED screen 100% maxed out and I cannot see any major differences between the 1GB textures and the 8GB textures. I guess it’s only in certain parts of the game. I played for well over an hour using 8GB Textures and didn’t notice a major increase in Image Quality and the same can be said for RE3. Now these are simply my opinions, but I guess because the games are so dark I don’t notice the texture.
Another thing to note is that my Fury X does NOT like 2 specific settings with the RE Engine. Those two settings are “Mesh” and “Shadows”. I cannot run those settings on “Max”, but I can run them perfectly fine on the very next setting “High” with no issues. “Mesh” and “Shadows” set to Max settings cause micro-stutter and just like that higher Texture settings, they don’t really increase the Image Quality so they aren’t worth the performance penalty in my honest opinion. DX12 performance in RE2 was more or less the same as DX11.
The reason I have decided to go with RE2 as my first benchmarked game is to show the FineWine in full effect. I ran plenty of benchmarks for this game last year and I’ll like to show those results since I never wrote a proper article for my Fury X RE2 benchmarks.
All settings are set to their max. I will explicitly explain what settings aren’t at their higest settings.
Resident Evil 2 – 1920x1080p
Shadows & Mesh = “High” - 1GB Textures
|
|
DX11 |
DX12 |
|
FPS MAX |
148.9 |
145.5 |
|
FPS Average |
113.7 |
114.4 |
|
FPS MIN |
75 |
84.5 |
_______________________________________________________________________________________
Resident Evil 2 – 1920x1080p
Shadows & Mesh = “High” - 8GB Textures
|
|
DX11 |
|
FPS MAX |
149.7 |
|
FPS Average |
116.7 |
|
FPS MIN |
74.5 |
_______________________________________________________________________________________
Resident Evil 2 – 1920x1080p
ALL SETTINGS SET TO HIGHEST SETTINGS
|
|
DX11 |
DX12 |
|
FPS MAX |
142.7 |
142.8 |
|
FPS Average |
108.8 |
108.4 |
|
FPS MIN |
47.3 |
41.9 |
Maxingthe game out at 1080p is a breeze as you can see. I did not expect the game to run so well 100% maxed out when the game first released.
Resident Evil 2 – 2560x1440p
Shadows & Mesh = “High” - 8GB Textures
|
|
DX11 |
|
FPS MAX |
105 |
|
FPS Average |
80.6 |
|
FPS MIN |
56.5 |
Resident Evil 2 – 2560x1440p
ALL GRAPHICAL OPTIONS SET TO HIGHEST SETTINGS
|
|
DX11 |
|
FPS MAX |
101.2 |
|
FPS Average |
76.3 |
|
FPS MIN |
49.6 |
While gaming at 1440p I didn’t even bother with DX12 since DX11 runs better and DX12 really offers no true benefits except better minimums in some cases, but the game feels a bit smoother while using the DX11 API. Capcom needs to go back to the drawing board on their DX12 API as well as most devs.
Resident Evil 2 – 3840x2160p – 4K
Shadows & Mesh = “High” + (1GB Textures)
|
|
DX11 |
DX12 |
|
FPS MAX |
53.4 |
52.2 |
|
FPS Average |
41.7 |
39.7 |
|
FPS MIN |
28.3 |
27.2 |
_______________________________________________________________________________________
Resident Evil 2 – 3840x2160p – 4K
Shadows & Mesh = “High” + (8GB Textures)
|
|
DX11 |
DX12 |
|
FPS MAX |
54 |
53.6 |
|
FPS Average |
41.2 |
41.8 |
|
FPS MIN |
28.3 |
29.2 |
_______________________________________________________________________________________
Resident Evil 2 – 3840x2160p – 4K
ALL GRAPHICAL OPTIONS SET TO HIGHEST SETTINGS
|
|
DX11 |
|
FPS MAX |
40.7 |
|
FPS Average |
24.8 |
|
FPS MIN |
7.9 |
I can run the game comfortably at 4K. Maxingthe game out at 4K is playable, but it won’t be a great experience due to Shadows and Mesh settings. Once those are dropped to high everything runs much better. Shadows & Mesh = “High” + (1GB Textures) is the best mix at 4K for me. I can’t complain about getting 40fps in 2020.
Resident Evil 2 - All Real Time Benchmarks

Resident Evil 3

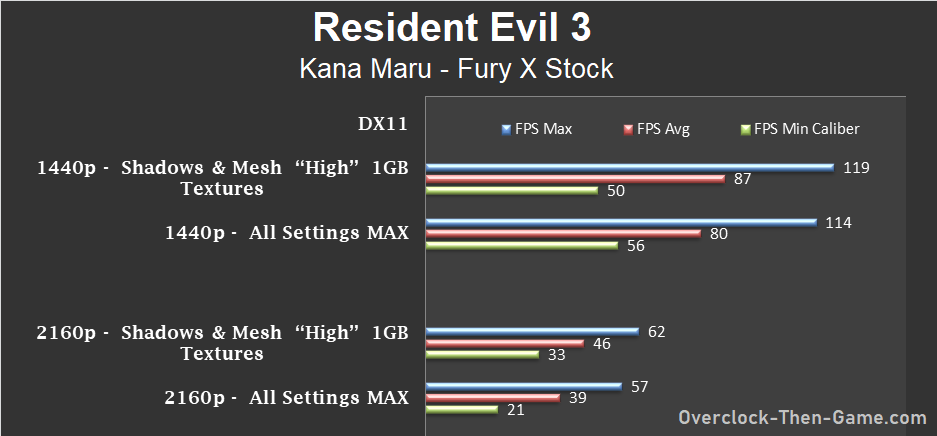
I will be using the same graphics settings since both games use the same engine. RE3 release on April 3 rd, 2020 and based on the RE2 results I had high hopes. As usual all settings are set to their max settings unless explicitly noted below:
Resident Evil 3 – 2560x1440p
Shadows & Mesh = “High” - 1GB Textures
|
|
DX11 |
|
FPS MAX |
118.8 |
|
FPS MAX Caliber ™ |
111.4 |
|
FPS Average |
87.3 |
|
FPS MIN Caliber ™ |
49.7 |
|
FPS MIN |
43.8 |
_______________________________________________________________________________________
Resident Evil 3 – 2560x1440p
ALL GRAPHICAL OPTIONS SET TO HIGHEST SETTINGS
|
|
DX11 |
|
FPS MAX |
113.6 |
|
FPS MAX Caliber ™ |
104.9 |
|
FPS Average |
80 |
|
FPS MIN Caliber ™ |
56.1 |
|
FPS MIN |
44.3 |
_______________________________________________________________________________________
Resident Evil 3 – 3840x2160p – 4K
Shadows & Mesh = “High” - 1GB Textures
|
|
DX11 |
|
FPS MAX |
62.1 |
|
FPS MAX Caliber ™ |
57.5 |
|
FPS Average |
46.3 |
|
FPS MIN Caliber ™ |
33.2 |
|
FPS MIN |
22.2 |
_______________________________________________________________________________________
Resident Evil 3 – 3840x2160p – 4K
ALL GRAPHICAL OPTIONS SET TO HIGHEST SETTINGS
|
|
DX11 |
|
FPS MAX |
57.1 |
|
FPS MAX Caliber ™ |
53 |
|
FPS Average |
39.2 |
|
FPS MIN Caliber ™ |
21.4 |
|
FPS MIN |
14.5 |
RE3 is no exception and runs just as well as RE2. Using Shadows Mesh on the "High" Setting is still the best combo at 4K. Maxing the game out at 4K isn't worth it due to the screen tearing and micro-stutter. The "Shadows" and "Mesh" Setting isn't worth maxing out anyways. Nonetheless, the Fury X works it's heart out and produces 39fps on average. As you can see I am enjoying this game @ 4K with the 1GB Textures + Shadows\Mesh set to high.
Resident Evil 3 - All Real Time Benchmarks
Ray Tracing - Crytek: Neon Noir
A few months ago Crytek finally released their Ray Tracking Benchmark. Ray Tracing has been the talk amogst gamers over the past few years and has been gaining wide-spread attention. Neon Noir works on AMD and Nvidia GPUs by using Cryteks Total Illumination tech within their CryEngine. Crytek produces some of the most graphically stunning games and Neon Noir is no exception, but the main focus is on the Ray Tracing. Let's see how well the Fury X handles Ray Tracing in 2020.
Neon Noir In-depth Analysis
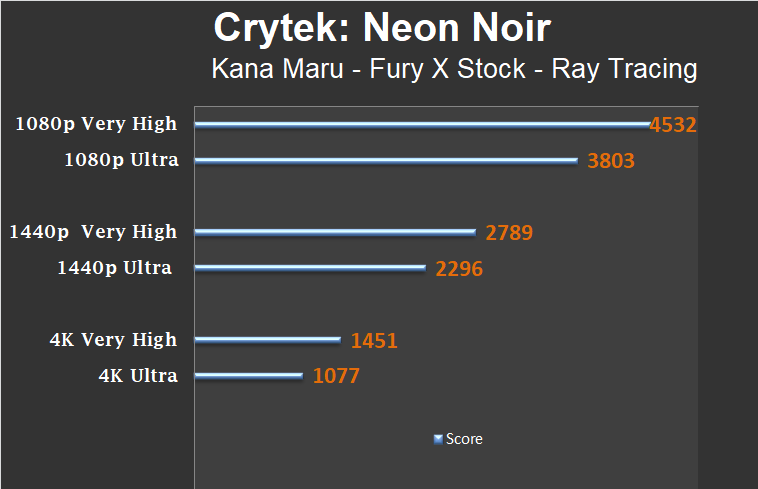
Diving a bit deeper I was able to see what was going on behind the scenes. Due to this being an fairly long article I will keep it as simple as possible without crazy charts most won't understand. Overall I felt like the card did fine for a 5 year old GPU at 1080p on Very High. 4K is pretty stressful, but that can be due many things as well including my 12 year old architecture (X58) and obviously the 5 year old GPU technology. Let's take a look at the performance numbers I pulled for each Ray Tracing Benchmark:
Neon Noir - 1920x1080p - Very High
|
|
DX11 |
|
FPS MAX |
92 |
|
FPS MAX Caliber ™ |
71 |
|
FPS Average |
52 |
|
FPS MIN Caliber ™ |
36 |
|
FPS MIN |
17 |
_______________________________________________________________________________________
Neon Noir - 1920x1080p - Ultra
|
|
DX11 |
|
FPS MAX |
63.2 |
|
FPS MAX Caliber ™ |
52 |
|
FPS Average |
45 |
|
FPS MIN Caliber ™ |
26 |
|
FPS MIN |
7.9 |
1080p on Very High settings were playable. The Ultra settings in some areas can bring the Fury X to its knees, but it keeps fighting through and still puts up decent numbers.
Neon Noir - 2560x1440p - Very High
|
|
DX11 |
|
FPS MAX |
45.5 |
|
FPS MAX Caliber ™ |
41 |
|
FPS Average |
33 |
|
FPS MIN Caliber ™ |
19.2 |
|
FPS MIN |
8.3 |
Neon Noir - 2560x1440p - Ultra
|
|
DX11 |
|
FPS MAX |
39 |
|
FPS MAX Caliber ™ |
32 |
|
FPS Average |
27.5 |
|
FPS MIN Caliber ™ |
15 |
|
FPS MIN |
6 |
Similar to the 1080p results, The Very High Preset at 1440p performs the best, but with the increase pixel count has the Radeon Fury X working overtime to crunch data. Very High still run surprisingly well overall.
Neon Noir - 3840x2160p - High
|
|
DX11 |
|
FPS MAX |
24.5 |
|
FPS MAX Caliber ™ |
20.4 |
|
FPS Average |
18 |
|
FPS MIN Caliber ™ |
8.7 |
|
FPS MIN |
2.3 |
_______________________________________________________________________________________
Neon Noir - 3840x2160p - Ultra
|
|
DX11 |
|
FPS MAX |
29.9 |
|
FPS MAX Caliber ™ |
18.4 |
|
FPS Average |
11.72 |
|
FPS MIN Caliber ™ |
2.4 |
|
FPS MIN |
1.1 |
It's safe to say that I won't be playing any Ray Tracing games at 4K if this benchmark shows what I can expect. The Fury X tries it's best during the 4K runs, but this card was obviously created during a period in time when Ray Tracing wasn't becoming mainstream. When the Fury X released the biggest thing during those times were VR (Virtual Reality) and 4K gaming. At least 1080p looks promising. Hopefully by then I would have made my choice between the Nvidia Ampere and AMD Navi. I hope AMD continues to use HBM for their higher end cards.
Shadow of the Tomb Raider
Crystal Dynamics is known make great games and Tomb Raider is one of my favorite franchises to date. Most TR games are demanding and requires a decent GPU to run. I have used both the Internal Benchmarks as well as running my own Real Time Benchmarks ™as usual.
I have used the Highest Preset in the game without Nvidia's HBAO+. That technology has caused issues in the previous Tomb Raider game and actually made the image quality worse therefore I choose to avoid it. I'm not sure if it makes the image quality better or worse in this game, but I honestly don't care. I'd rather not take the performance hit using Nvidia Gameworks. For this benchmark I played the first level in the game where you actually take control of Lara.
Real Time Benchmarks ™
Shadow of the Tomb Raider - 1920x1080p
Highest Preset - TAA - BTAO - DX12
|
|
DX12 |
|
FPS MAX |
91.9 |
|
FPS MAX Caliber ™ |
64.5 |
|
FPS Average |
55 |
|
FPS MIN Caliber ™ |
48.8 |
|
FPS MIN |
44.7 |
_______________________________________________________________________________________
Shadow of the Tomb Raider - 2560x1440p
Highest Preset - TAA - BTAO - DX12
|
|
DX11 |
|
FPS MAX |
64.3 |
|
FPS MAX Caliber ™ |
48.4 |
|
FPS Average |
40.6 |
|
FPS MIN Caliber ™ |
34.9 |
|
FPS MIN |
31.1 |
_______________________________________________________________________________________
Shadow of the Tomb Raider - 3840x2160p
Highest Preset - TAA - BTAO - DX12
|
|
DX12 |
|
FPS MAX |
52.8 |
|
FPS MAX Caliber ™ |
29 |
|
FPS Average |
23.8 |
|
FPS MIN Caliber ™ |
19.8 |
|
FPS MIN |
15.7 |
Shadow of the Tomb Raider - All Real Time Benchmarks

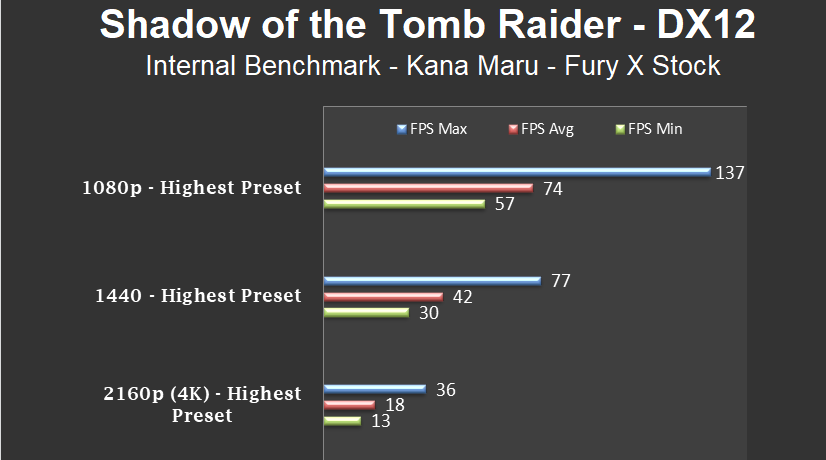
Internal Benchmark Tool
The game performs very well at 1080p and 1440p with the highest preset. 4K really pushses the card to its limits which is expected from a Tomb Raider game. Obviously I can lower the preset and get more FPS, but I wanted to show what the Fury X is still cable of across the board. Plus I benchmarked tons of games and can't focus solely on Tomb Raider :)
Hitman 2

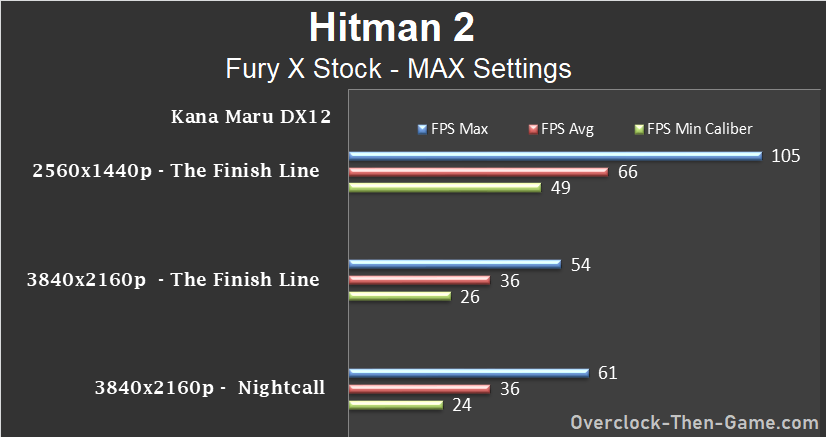
I ran all of the benchmarks using DX11 since DX12 was giving me a few issues. All of the settings were set to their highest possible levels except Dynamic Sharpening whch was disabled.
Real Time Benchmarks ™
Hitman 2 - 2560x1440p
Max Settings - The Finish Line
|
|
DX11 |
|
FPS MAX |
105.3 |
|
FPS MAX Caliber ™ |
92.1 |
|
FPS Average |
66.2 |
|
FPS MIN Caliber ™ |
49.7 |
|
FPS MIN |
37.1 |
_______________________________________________________________________________________
Hitman 2 - 3840x2160p
Max Settings - The Finish Line
|
|
DX11 |
|
FPS MAX |
53.8 |
|
FPS MAX Caliber ™ |
46.8 |
|
FPS Average |
36 |
|
FPS MIN Caliber ™ |
26.2 |
|
FPS MIN |
16.6 |
_______________________________________________________________________________________
Hitman 2 - 3840x2160p
Max Settings - Nightcall
|
|
DX11 |
|
FPS MAX |
61.1 |
|
FPS MAX Caliber ™ |
50.5 |
|
FPS Average |
36 |
|
FPS MIN Caliber ™ |
23.6 |
|
FPS MIN |
15.3 |
Hitman 2 - All Real Time Benchmarks
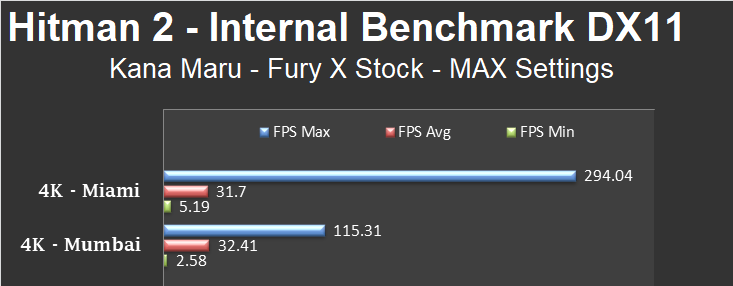
Internal Benchmark Tool
The in-game benchmark in Hitman games always extremely have high max FPS and insanely low FPS. Maxing out the game at 4K is playable during actual gameplay, but during loading areas you might encounter some micro-stutter for split second. Lowering a few settings makes the game run much smoother at 4K. 1440p with 100% max settings is the sweet spot as usual. In games such as Hitman I prefer to lower a few settings and play in 4K. With max graphic settings @ 4K the game runs really well in my opinion and I was actually surprised at the 4K performance with all of the NPCs on screen.
Middle-earth: Shadow of War
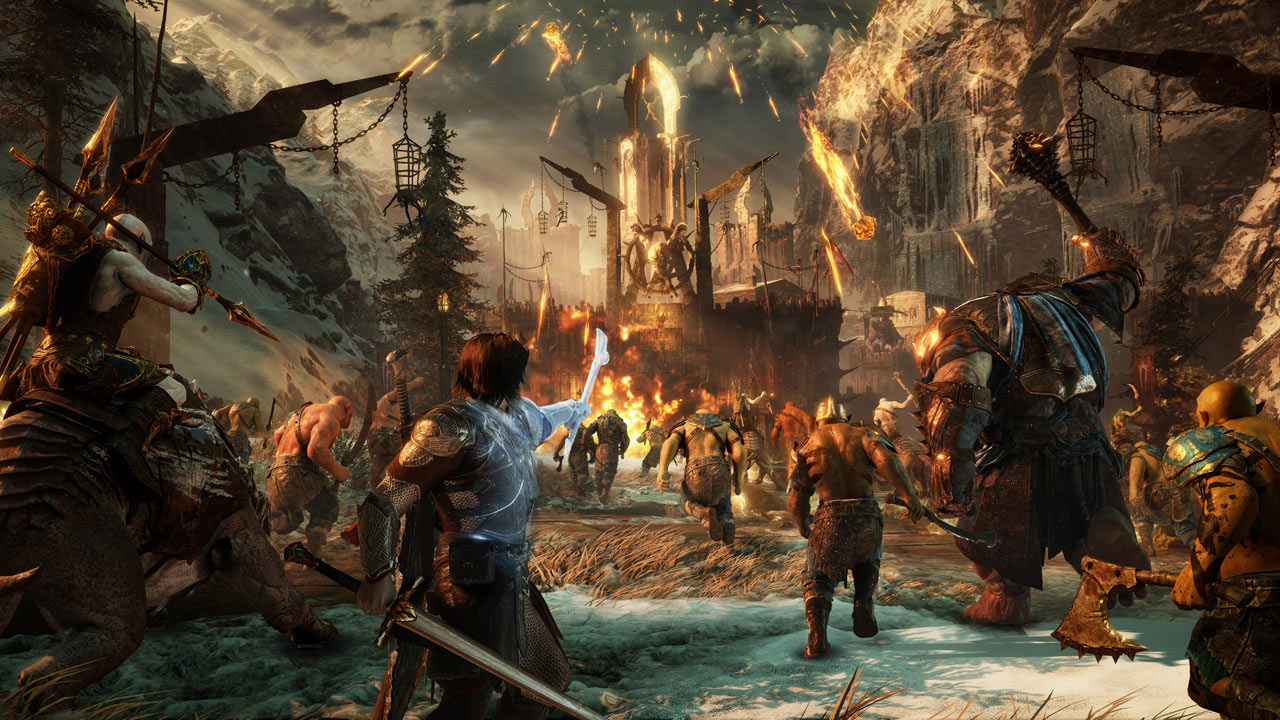
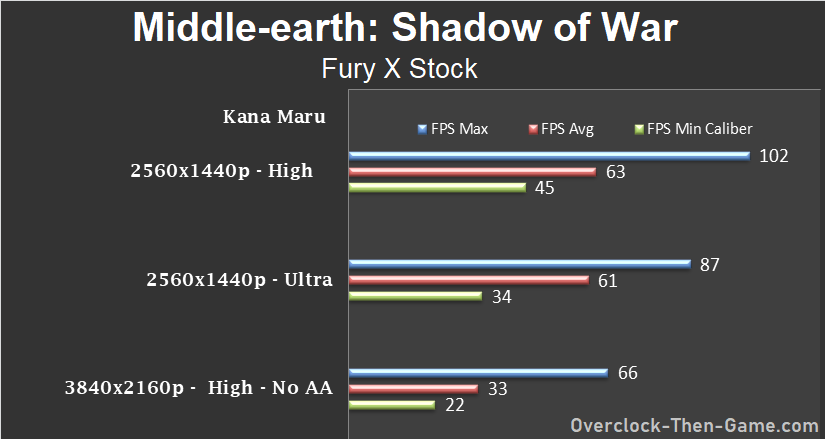
Middle-earth: Shadow of War - 2560x1440p
High Settings
|
|
DX11 |
|
FPS MAX |
101.5 |
|
FPS MAX Caliber ™ |
89.1 |
|
FPS Average |
63 |
|
FPS MIN Caliber ™ |
44.6 |
|
FPS MIN |
37.9 |
_______________________________________________________________________________________
Middle-earth: Shadow of War - 2560x1440p
Ultra Settings
|
|
DX11 |
|
FPS MAX |
86.6 |
|
FPS MAX Caliber ™ |
77.2 |
|
FPS Average |
61 |
|
FPS MIN Caliber ™ |
33.8 |
|
FPS MIN |
26.4 |
_______________________________________________________________________________________
Middle-earth: Shadow of War - 3840x2160p
High Settings - No AA
|
|
DX11 |
|
FPS MAX |
65.3 |
|
FPS MAX Caliber ™ |
55.6 |
|
FPS Average |
33 |
|
FPS MIN Caliber ™ |
21.5 |
|
FPS MIN |
18.4 |
Middle-earth: Shadow of War - All Real Time Benchmarks
Devil May Cry 5
Devil May Cry 5 - 2560x1440p
Max Settings
|
|
DX12 |
|
FPS MAX |
244.7 |
|
FPS MAX Caliber ™ |
149.8 |
|
FPS Average |
117.6 |
|
FPS MIN Caliber ™ |
68.4 |
|
FPS MIN |
46.4 |
_______________________________________________________________________________________
Devil May Cry 5 - 3840x2160p
Max Settings
|
DX12 |
|
|
FPS MAX |
120 |
|
FPS MAX Caliber ™ |
96.6 |
|
FPS Average |
70 |
|
FPS MIN Caliber ™ |
43.8 |
|
FPS MIN |
23.8 |
Wolfenstein II: The New Colossus

Real Time Benchmarks
™
Wolfenstein II: The New Colossus -
2560x1440p
Ultra - TAA
|
Vulkan |
|
|
FPS MAX |
118 |
|
FPS MAX Caliber ™ |
106 |
|
FPS Average |
69 |
|
FPS MIN Caliber ™ |
49 |
|
FPS MIN |
42 |
_______________________________________________________________________________________
Wolfenstein II: The New Colossus -
2560x1440p
Ultra - TSSAA 8TX
|
Vulkan |
|
|
FPS MAX |
119.7 |
|
FPS MAX Caliber ™ |
101.4 |
|
FPS Average |
59 |
|
FPS MIN Caliber ™ |
33 |
|
FPS MIN |
28 |
_______________________________________________________________________________________
Wolfenstein II: The New Colossus -
2560x1440p
Mein Leben!
|
Vulkan |
|
|
FPS MAX |
101 |
|
FPS MAX Caliber ™ |
91 |
|
FPS Average |
50 |
|
FPS MIN Caliber ™ |
25 |
|
FPS MIN |
21 |
_______________________________________________________________________________________
Wolfenstein II: The New Colossus - 3840
x2160p
Mein Leben! - no AA
|
Vulkan |
|
|
FPS MAX |
65 |
|
FPS MAX Caliber ™ |
47 |
|
FPS Average |
31 |
|
FPS MIN Caliber ™ |
21 |
|
FPS MIN |
18 |
Since I ran so many test in this game here is a benchmark chart to break it all down.
Wolfenstein II: The New Colossus - All Real Time Benchmarks
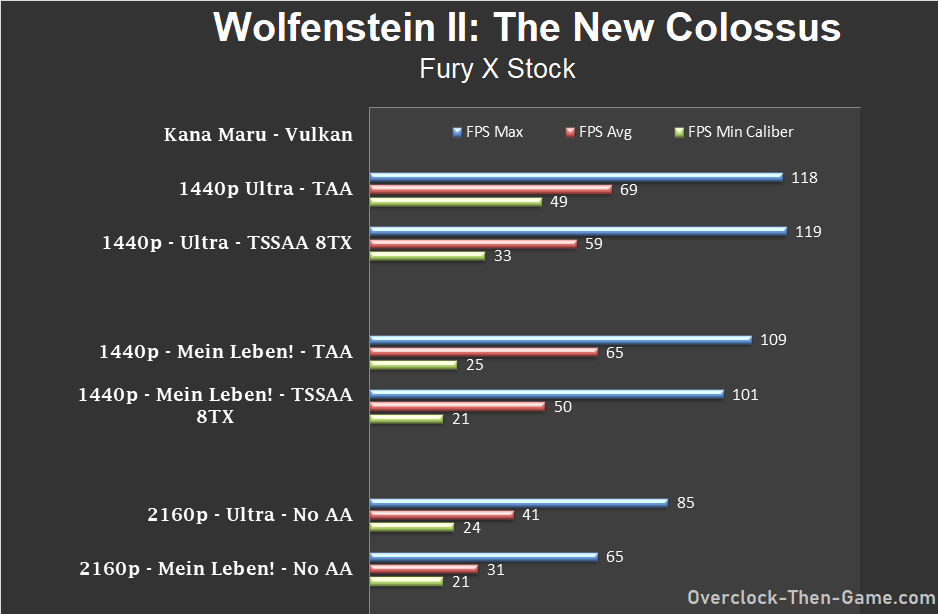
Please do not forget that these are not the absolute lows and the minimum frames won't always be that low during gameplay, the same goes for the high fps as well. However, I can honestly say that the game runs fairly well at 4K with no AA. Certain parts of the game is more polished than others, but 1440p is still the sweet spot.
Rainbow Six: Siege
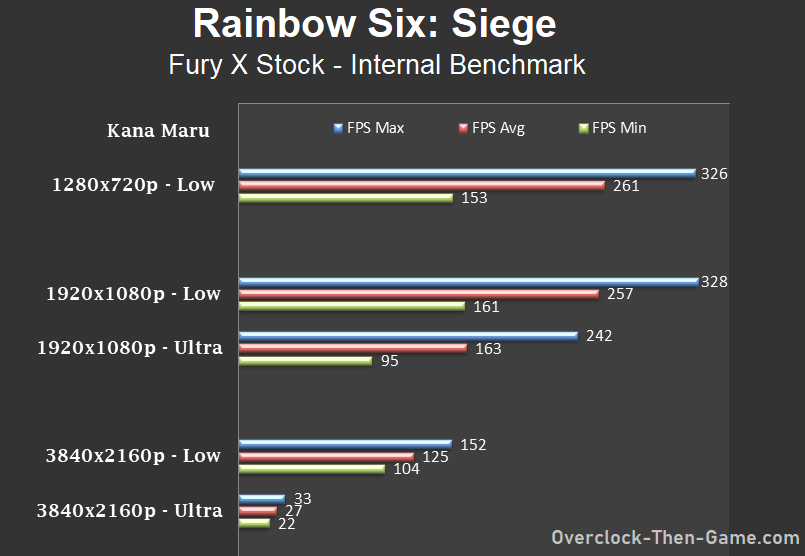
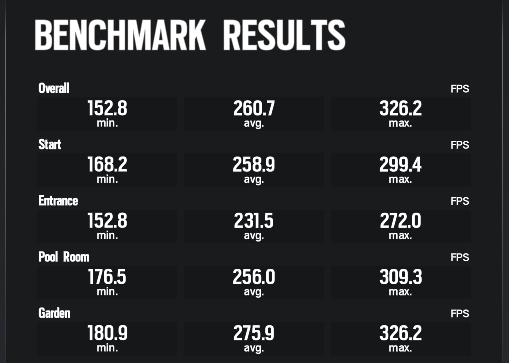
I have yet to play an online multiplayer game for my Real Time Benchmarks so I decided to use the Internal Benchmark. If it is requested in the comments section I will run some benchmarks from actual gameplay. It takes a very long time to bring you guys content and as you can see I have went out of my way to benchmark plenty of games. Being that popular games such as Rainbow Six: Siege is aimed at the e-sport competitive gamers I have ran the benchmarks using the 720p resolution in addition to higher resolutions. Here is the type of experience you can expect from this X58 + Fury X Stock combo.
Internal Benchmark Tool
1280x720p
Low Settings
_______________________________________________________________________________________
1920x1080p
Low & Ultra Settings

_______________________________________________________________________________________
3840x2160p
Low & Ultra Settings
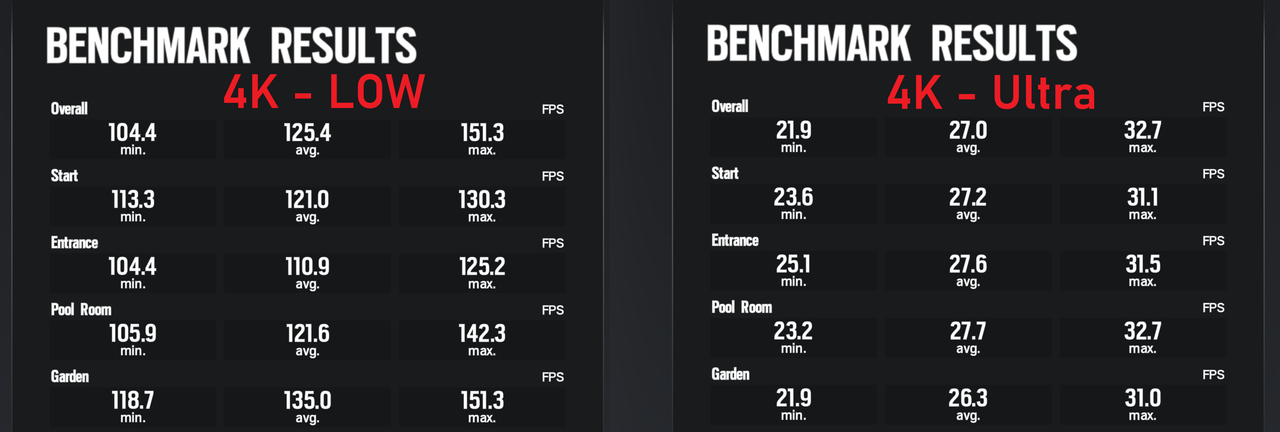
It's pretty obvious how far my CPU can go at only 4Ghz with 720p, but that's more than enough frames for competitive play.
